FIGURE 3.
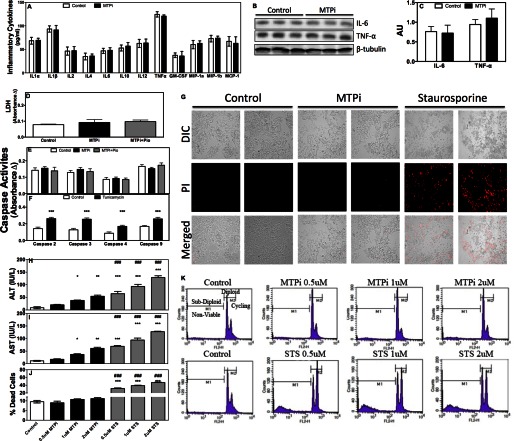
MTP inhibitor does not increase cytokine levels or cell death. A–C, C57BL/6J (n = 6) mice were fed Western diet for 37 days. DMSO (Control) or MTPi was administered in the last 7 days. A, ELISA was used to assay plasma cytokines (SABiosciences). Plasma samples from 2 animals were pooled. Therefore, data are average and S.D. of 3 determinations. B, Western blot analysis of proteins associated with inflammation. C, protein bands were quantified. D, lactate dehydrogenase (LDH) was assessed from plasma samples obtained from animals as described in the legend to Fig. 2. E, different caspase activities were measured in the livers of mice from Fig. 2. F, C57BL/6J mice on chow diet were injected intraperitoneally with 1.5 mg/kg of tunicamycin. Livers were collected after 24 h and used to measure caspase activities. G, Huh-7 cells on coverslips were treated with either 1 μm MTPi or staurosporine, stained with propidium iodide (PI), and photographed. Data are representative of three experiments. H–K, Huh-7 cells (n = 3) were treated with 0.5, 1, or 2 μm MTPi or staurosporine (STS) for 24 h. Media were used to measure ALT/AST (H and I). Cells were fixed, stained with PI, and analyzed by flow cytometry. Percent of dead cells (J) is plotted. Flow diagrams (K) illustrate sub-diploid/non-viable and diploid/viable cell counts. Data are representative of three experiments. Comparisons with Controls and MTPi are designated with * and #, respectively. Values are mean ± S.D.; *, #, p < 0.05; **, ##, p < 0.01; ***, ###, p < 0.001.

