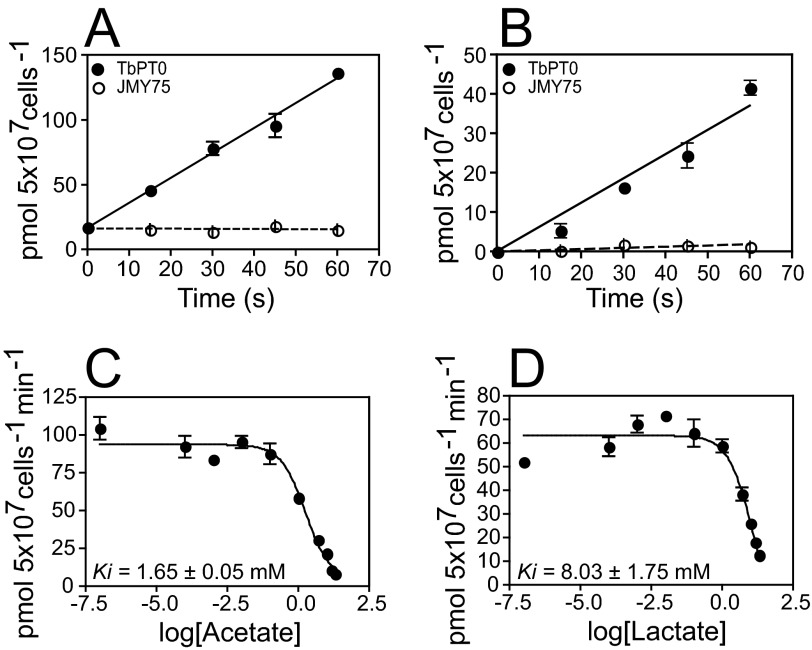
FIGURE 5.
[14C]acetate and [14C]lactate transport by TbPT0. Time course for uptake of 28 μm [14C]acetate (A) and 18 μm [14C]lactate (B) by yeast expressing TbPT0 cDNA (closed circles) or JMY75 (open circles) as control. C, 26 μm [14C]pyruvate uptake inhibition by increasing concentrations of acetate. D, 26 μm [14C]pyruvate uptake inhibition by increasing concentration of lactate. Error bars represent the standard deviation for uptake assays performed in duplicate.

