FIGURE 4.
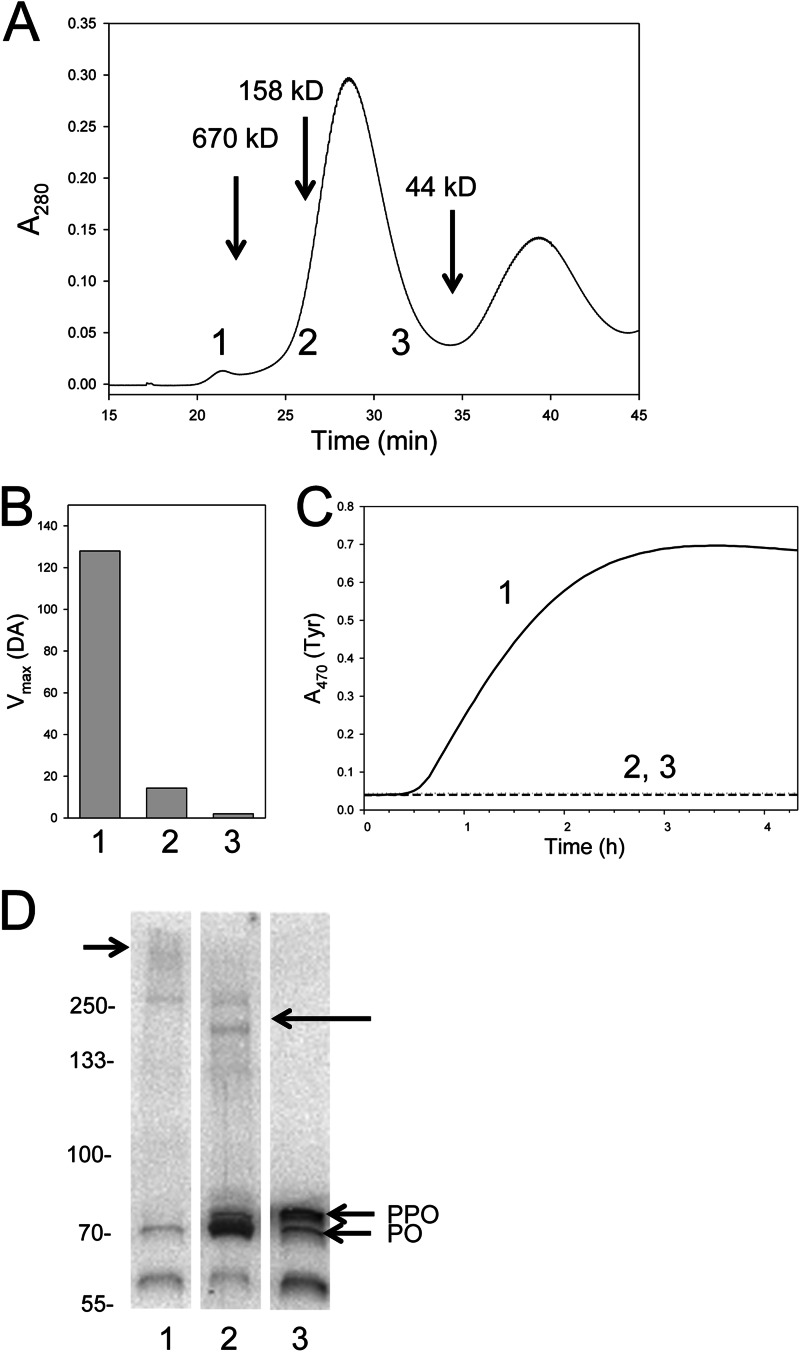
Tyr-dependent melanization in B. mori is associated with a high molecular mass fraction. A, plasma was separated by Sephacryl S-300 HR chromatography. Protein eluent was measured at A280 from the void volume of the column to 45 min. The elution times for the 670-, 158-, and 44-kDa protein standards eluted are indicated. Fractions (0.7 ml) were collected from 17 min (void volume of the column) to 45 min and assayed using DA or Tyr as the substrate. Three of these fractions (numbered 1, 2, and 3) are indicated at the bottom of the chromatogram. B, melanization activity for fractions 1, 2, and 3 using DA as the substrate. Substrate was added to the fraction at a final concentration of 0.5 mm, followed by monitoring of dopachrome or dopaminechrome at A470. Vmax values (milli-optical density/min) are presented because kinetics were linear. C, melanization activity for fractions 1–3 using Tyr as the substrate was measured in the same manner as for DA, but results are plotted as a time course. Note that melanization rates are lower than for whole plasma because of sample dilution. D, the proteins in fractions 1–3 were separated on a 4–20% SDS-polyacrylamide gel under reducing conditions, followed by immunoblotting using α-PPO1/2. Bands corresponding to monomeric PPO and PO are indicated. The ∼60 kDa band recognized by α-PPO1/2 corresponds to the predicted mass of PO cleaved at a second Arg-Phe site that exists downstream of the site normally associated with processing of PPO to PO. A short arrow (left) points to a diffuse high mass band recognized by α-PPO1/2 in fraction 1. A long arrow (right) points to two higher molecular mass bands that run between the 250 and 133 kDa markers that was recognized by α-PPO1/2 in fraction 2. Molecular mass markers are indicated on the left.

