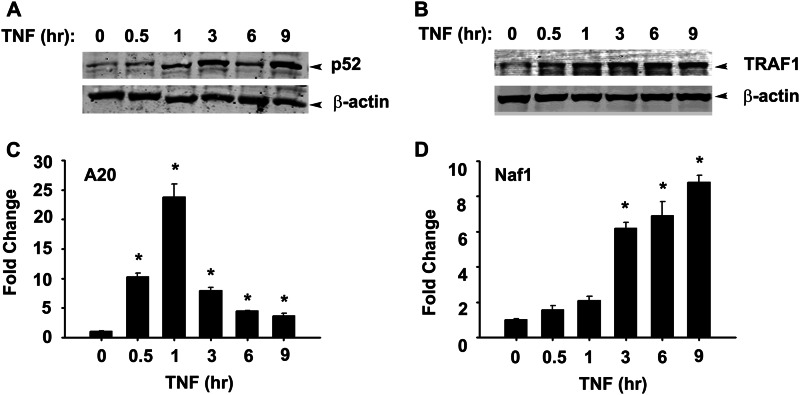
FIGURE 2.
TNF-induced non-canonical pathway activation in NHBE cells. A, shown are cells treated with TNF (25 ng/ml) for the indicated times. Shown is the WB analysis of nuclear p52. B, a WB shows a time course of TRAF1 expression in the cytosolic fraction of TNF-treated NHBE cells. C and D, NHBE cells were stimulated with TNF (25 ng/ml) for the indicated times. A20 and ABIN1/Naf1 expression was measured by Q-RT-PCR. Data expressed as -fold change was compared with untreated cells after normalizing to internal controls, GAPDH. Data were analyzed by one-way ANOVA with multiple comparisons. Significantly different from untreated samples: *, p < 0.01.

