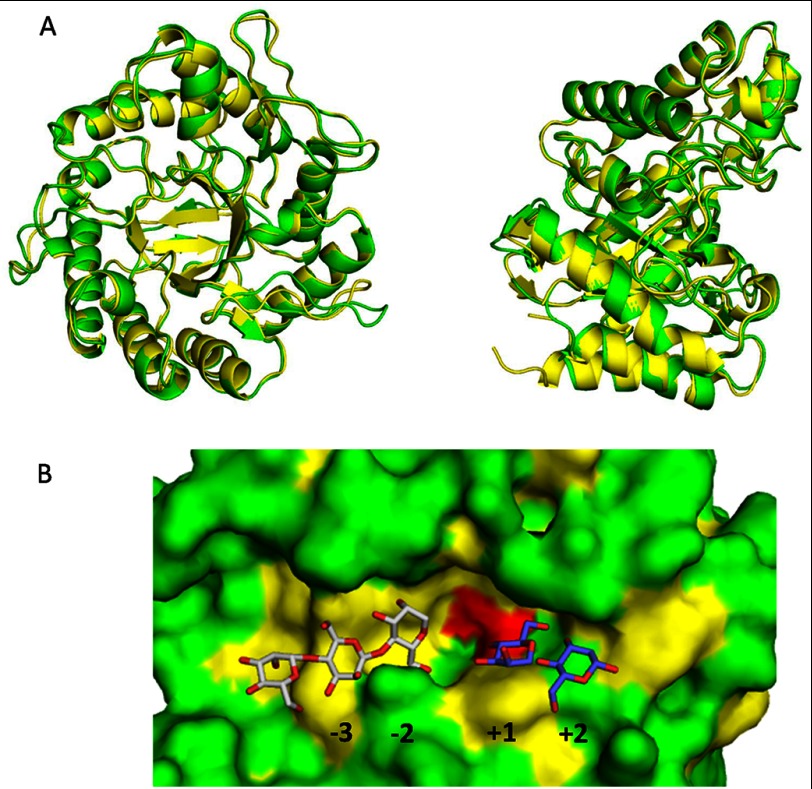
FIGURE 4.
Crystal structure of PaMan5A. A, superposition of PaMan5A (green) and TrMan5A (yellow) structures is shown. The two views are related by a rotation of ∼90° about the vertical axis. B, shown is a surface view of the catalytic cleft of PaMan5A with mannotriose modeled in the −2 and −3 subsites and mannobiose modeled in the +1 and +2 subsites. The structures of GH5 from T. reesei and T. fusca in complex with mannobiose and mannotriose, respectively, were superimposed on the top of the structure of PaMan5A to map the substrate binding subsites.

