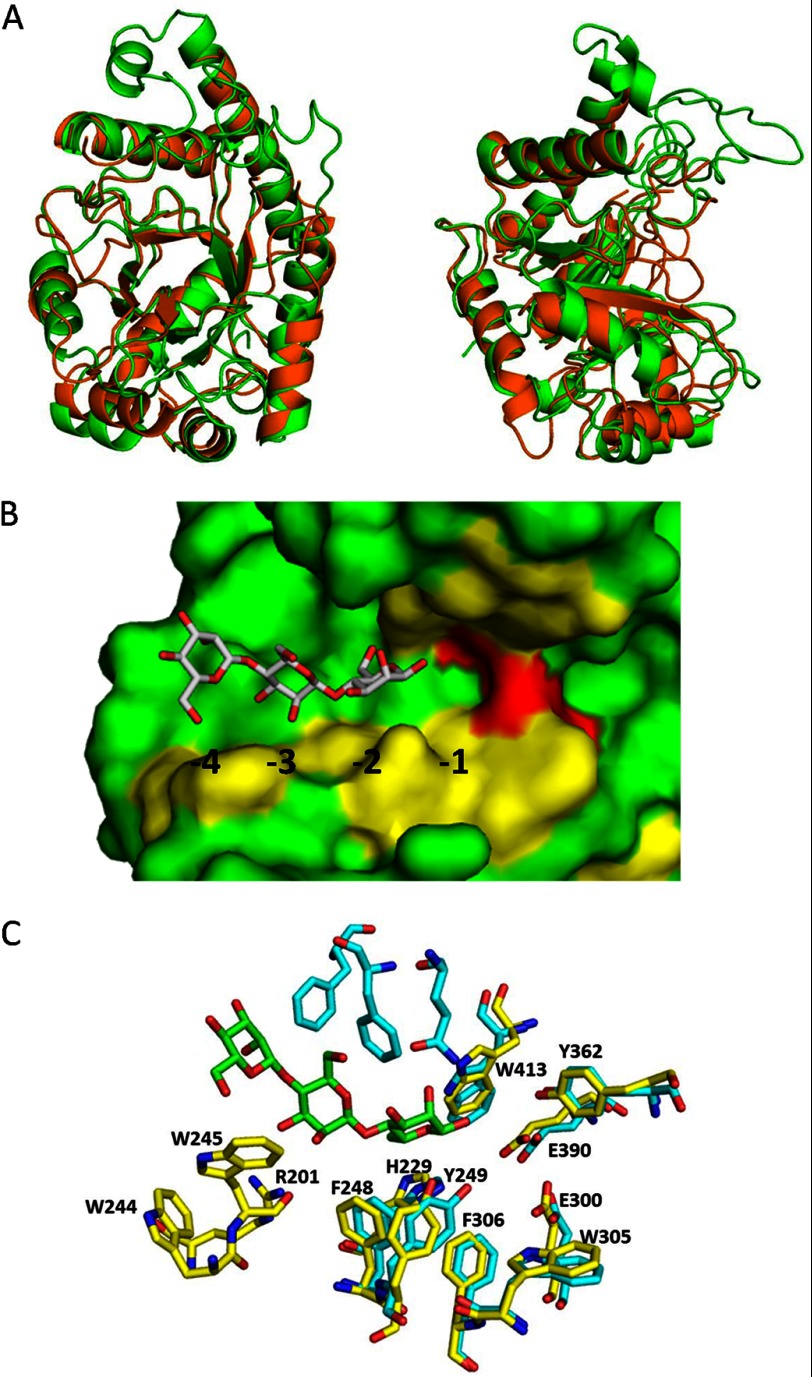
FIGURE 5.
Crystal structure of PaMan26A. A, superposition of PaMan26A catalytic module (green) and BCMan (orange) structures. The two views are related by a rotation of ∼90° about the vertical axis. B, shown is a surface view of the catalytic cleft of PaMan26A with mannotriose modeled in the −2 to −4 subsites. The structure of GH26 from C. fimi in complex with mannotriose was superimposed on the top of the structure of PaMan26A to map the substrate-binding subsites. C, shown is the organization of the glycone binding subsites in PaMan26A (yellow) compared with C. fimi (cyan).

