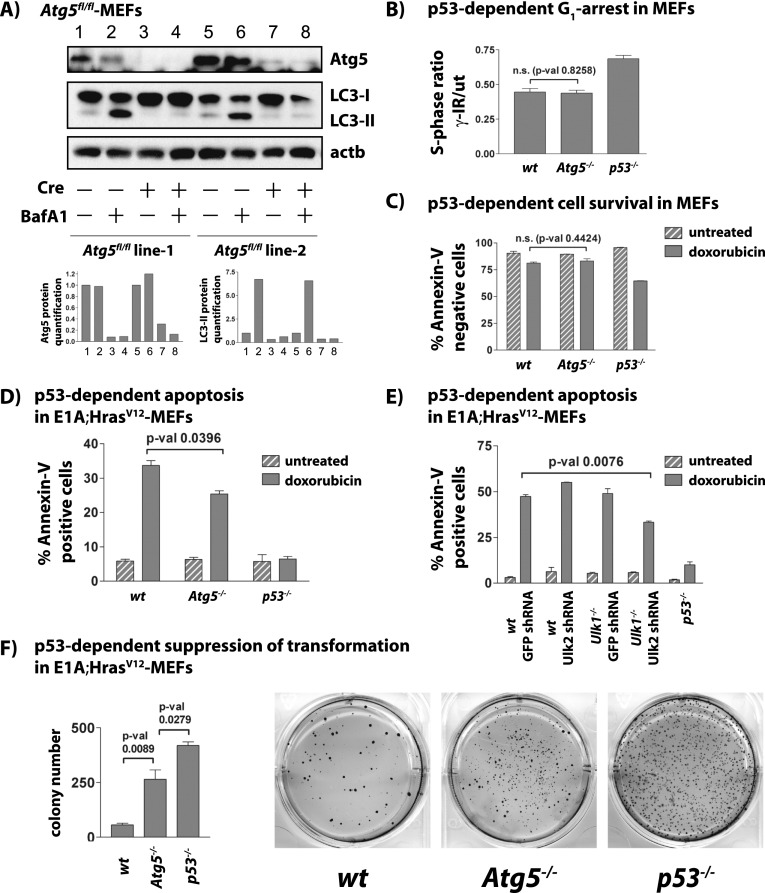
Figure 6.
Autophagy deficiency does not compromise DNA damage-induced cell cycle arrest and survival but impairs p53-dependent apoptosis and suppression of transformation. All experiments were performed with two independent Atg5fl/fl MEF cell lines and at least in duplicate. (A, top) Western blot analysis confirming decreased Atg5 protein levels and inhibition of autophagy as assessed by LC3-II 48 h after Ad-Cre (+Cre) or Ad-empty (−Cre) infection. β-Actin serves as a loading control. (Bottom) Quantification of Atg5 and LC3-II is shown relative to β-actin. (B) Graph showing the average S-phase ratios of γ-irradiated/untreated MEFs for each genotype. The P-value was calculated by the Student's t-test. (C) p53-dependent cell survival in primary MEFs upon exposure to DNA damage (dox) for 72 h. Shown are the average percentages ± SD of technical replicates of AnnexinV-negative cells from a representative experiment. (D) p53-dependent apoptosis in E1A;HrasV12 MEFs of different genotypes after 18 h of DNA damage treatment (dox). Shown are the average percentages ± SD of AnnexinV-positive cells from a representative experiment using two MEF lines per genotype. The P-value was calculated by the Student's t-test. (E) p53-dependent apoptosis in E1A;HrasV12;wild-type and E1A;HrasV12;Ulk1−/− MEFs transduced with negative control GFP shRNAs or Ulk2 shRNAs after 18 h of DNA damage treatment (dox). Shown are the average percentages ± SD of AnnexinV-positive cells from one representative of more than three independent experiments, with error bars indicating technical replicates, and P-values calculated by the Student's t-test. (F) Soft agar assay for p53-dependent suppression of transformation in E1A;HrasV12 MEFs. Quantification shows average colony number ± SD. The P-values were calculated by the Student's t-test. Shown are representative wells of 3-wk Giemsa-stained colonies from one experiment of four, each with technical triplicates.

