
Figure 5.
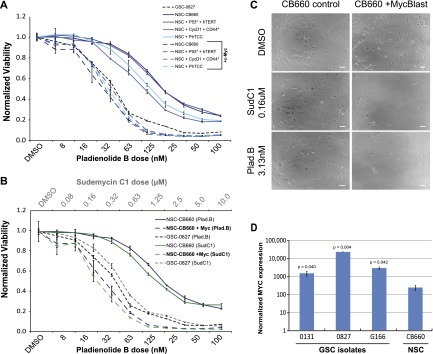
MYC expression in NSCs recapitulates GSC sensitivity to splicing inhibition. (A) Viability of NSCs with or without expression of hTERT, p53DD, CyclinD1, CDK4R24C, and/or MYC after treatment with pladienolide B. (B) Viability of NSCs with or without MYC expression after treatment with SudC1 (top X-axis) or pladienolide B (bottom X-axis). (C) Micrographs of normal CB660 NSCs with or without MYC expression after treatment with the indicated splicing inhibitors. Bar, 64 μm. (D) Log graph of MYC levels in GSCs and NSCs as determined by RNA-seq (fragments per kilobase of exon per million reads mapped [FPKM] normalized; n = 3) (Ding et al. 2013). P-values were determined by Student's t-test. See also Supplemental Figures S5 and S6.