
Figure 1.
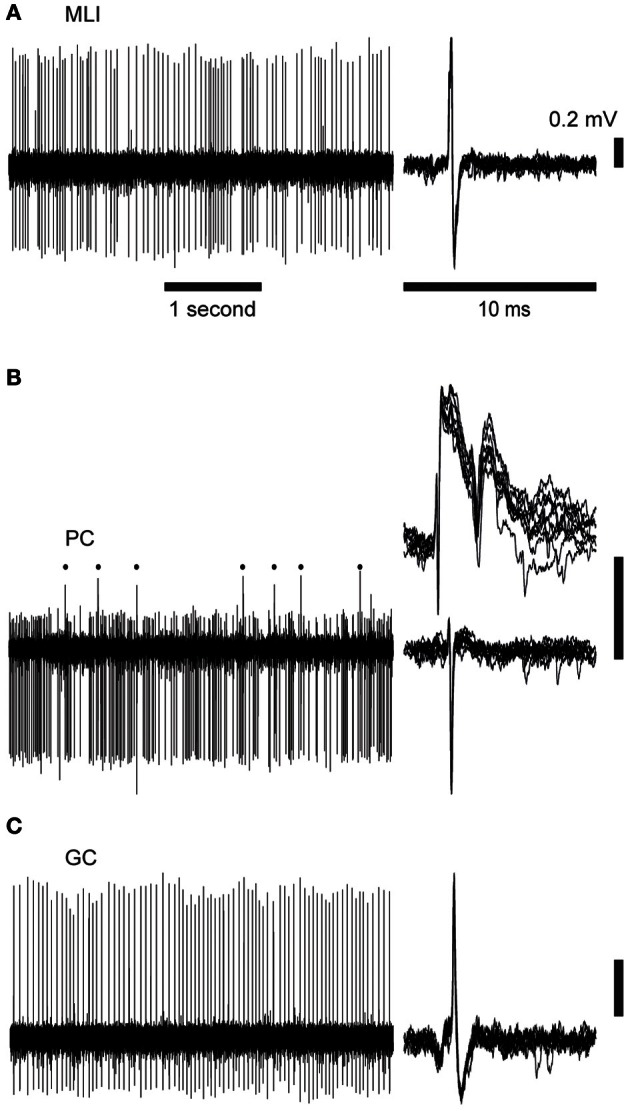
Cell activity records. Time scales are 1 s (left) and 10 ms (right). The panels to the left illustrate raw spontaneous activity, the right hand panels illustrate 10 superimposed spikes. Vertical scale bars indicate 0.2 mV potential. (A) Spontaneous spike activity of a molecular layer interneuron (MLI). (B) Purkinje cell (PC) with complex spikes (upper right panel and indicated by dots in the left panel) and simple spikes (lower right). (C) Spike activity of a Golgi cell (GC).