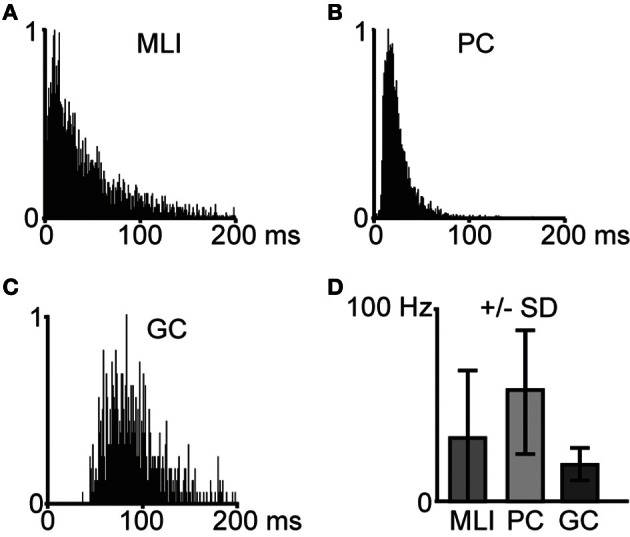
Figure 2.

Characteristics of spontaneous spike activity in cerebellar cortical neurons. (A–C) Frequency distribution histograms that illustrate interspike intervals in example cells (N = 1 for each histogram). Bin width is 1 ms. (A) Molecular layer interneuron (MLI), (B) Purkinje cell (PC), and (C) Golgi cell (GC). (D) Average spontaneous spike frequencies for molecular layer interneurons (MLI, N = 11), Purkinje cells (PC, N = 6), and Golgi cells (GC, N = 5). Error bars indicate ± one standard deviation.
