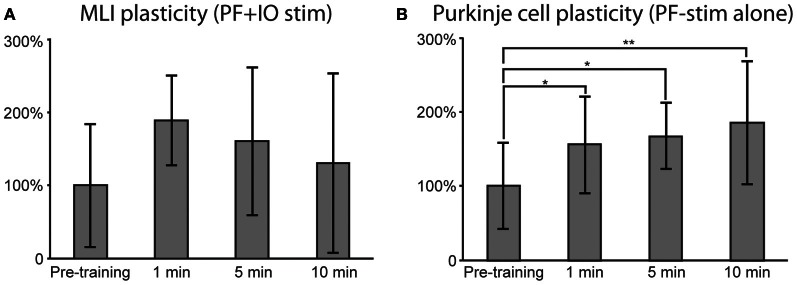
Figure 6.

Effects of plasticity protocols. Similar to Figure 5, responses to PF stimulation were quantified before and after the stimulation protocols. (A) For MLIs, mean responses after pooling the data from both plasticity protocols (N = 6). A repeated measures ANOVA revealed a trend, though not a significant effect (p = 0.06). (B) PC responses after PF alone plasticity protocol (N = 6). A repeated measure ANOVA followed by post-hoc Tukey tests revealed statistically significant differences between pre-training and all post-training time points. In (A) and (B), error bars indicate ± one standard deviation.
