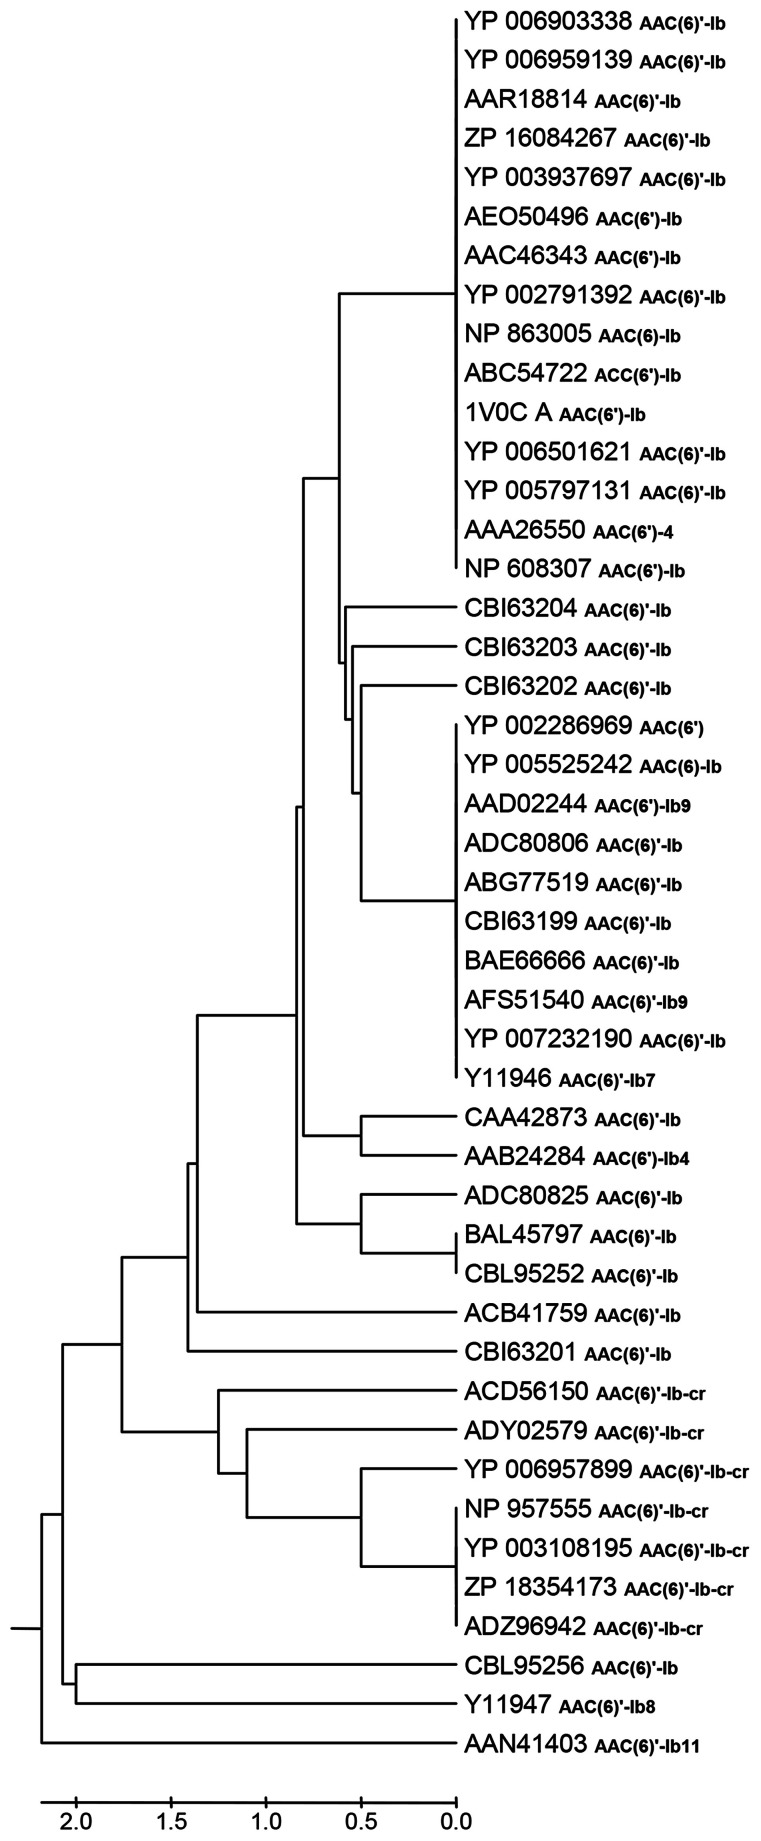
Figure 1.
UPGMA clustering analyses of 45 AAC(6′)-Ib protein sequences. The optimal tree with the sum of branch length = 20.70628249 is shown. The evolutionary distances were computed using the number of differences method and are in the units of the number of amino acid differences per sequence. All positions containing gaps and missing data were eliminated. There were a total of 181 positions in the final dataset. Evolutionary analyses were conducted in MEGA5.

