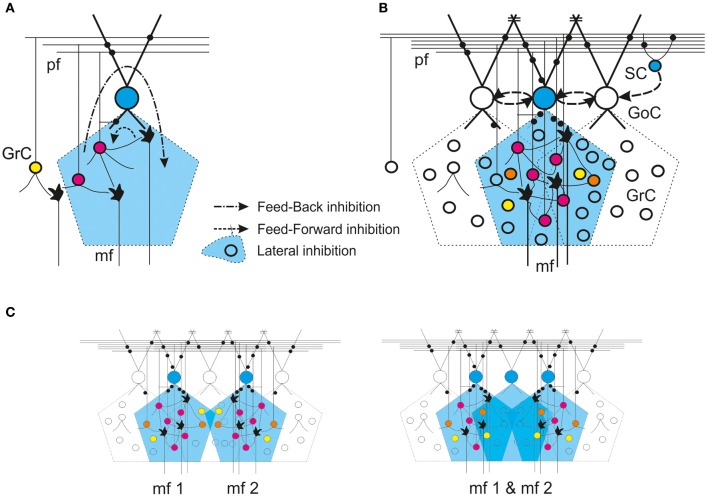
Figure 4.
Golgi cell connectivity. Schematic representation of different modalities of Golgi cell connectivity. In all panels, the active Golgi cells are depicted in blue and the intensity of granule cell activity is scaled from blue (no activity) through yellow and orange to red (increasing activity). Synapses are in black. GoC Golgi cell, GrC granule cell, SC stellate cell, mf mossy fiber, pf parallel fiber. Inhibitory connections between Golgi cells and from stellate to Golgi cells are indicated with dashed arrow-lines. The gap junctions are indicated by =. (A) Feedforward and feedback loops. (B) Lateral inhibition. (C) Overlapping of axonal fields. Note that, in the area in common to two neighboring mossy fiber bundles, the circuit can generate combined excitation of the granule cells, but activation of an extra Golgi cell can generate a combined inhibition.

