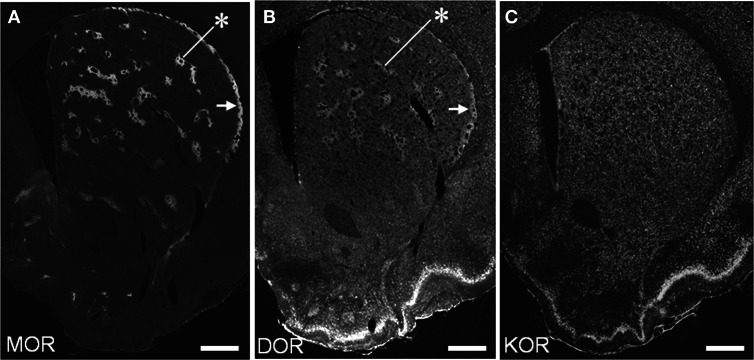
Figure 2.
Distributional patterns of MOR, DOR, and KOR in the striosome-matrix systems of the rat striatum. Single-label TSA immunostaining of the striatum using the antibody against MOR (A), DOR (B) or KOR (C). Asterisks indicate examples of the striosomes, and arrows do the subcallosal streak. Scale bars = 500 μm.

