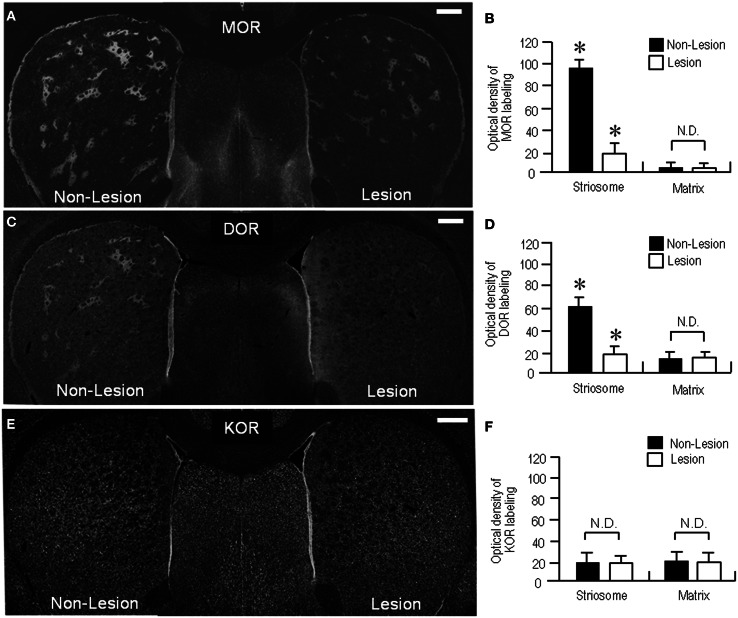
Figure 6.
Loss of striosomal labeling for MOR and DOR in rats with unilateral 6-OHDA lesions of nigrostriatal pathways. (A) A representative image of the forebrain sections stained for MOR. (B) Optical density measurements of MOR labeling in the striosomes and matrix compartment in the dorsolateral portions of the non-lesioned (Non-Lesion) and lesioned (Lesion) striatum. Data are mean ± S.E.M. (bars) values (n = 25). *P < 0.005 (Mann–Whitney U-test), Non-Lesion vs. Lesion. N.D. indicates no statistically significant difference (P > 0.05, Mann–Whitney U-test) between Non-Lesion and Lesion. (C) A representative image of the forebrain sections stained for DOR. (D) Optical density measurements of DOR labeling in the striosomes and matrix compartment in the dorsal striatum of the non-lesioned (Non-Lesion) and lesioned (Lesion) striatum. Data are mean ± S.E.M. (bars) values (n = 25). *P < 0.01 (Mann–Whitney U-test), Non-Lesion vs. Lesion. N.D. indicates no statistically significant difference (P > 0.05, Mann–Whitney U–test) between Non-Lesion and Lesion. (E) A representative image of the forebrain sections immunostained for KOR. No apparent difference in striatal KOR-labeling is found between the non-lesioned (Non-Lesion) and lesioned (Lesion) sides. (F) Optical density measurements of KOR labeling in the striosomes and matrix compartment in the dorsal striatum of the non-lesioned (Non-Lesion) and lesioned (Lesion) striatum. Data are mean ± S.E.M. (bars) values (n = 25). N.D. indicates no statistically significant difference (P > 0.05, Mann–Whitney U-test) between Non-Lesion and Lesion. Scale bars = 500 μm.

