
Table 3.
Exploration of adhesion parameters in spheroids attached to the surface of the small intestine.
| Parameters tested | Results | Spheroid images |
|||
|---|---|---|---|---|---|
| 2-D (tumor center) | 3-D | ||||
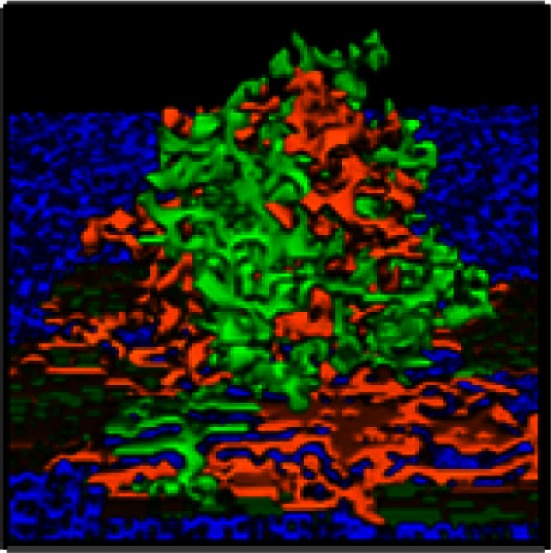
| Low homotypic adhesion and low heterotypic adhesion to non-tumor cells | By 24 h, tumor cells show reduced volume and the spheroid is no longer cohesive |  |
 |
||
| Cell type 1 | Cell type 2 | Adhesion 1 ⇔ 2 | |||
| PTC | PTC | 20 | |||
| PTC | other | 20 | |||
| other = PF, ECM, VM, and SM | |||||
| Low homotypic adhesion and high heterotypic adhesion | By 24 h, the spheroid has fragmented while the mesothelium has aggregated |  |
 |
||
| Cell type 1 | Cell type 2 | Adhesion 1 ⇔ 2 | |||
| PTC | PTC | 20 | |||
| PTC | other | Tested 0, 1, 3, and 5 | |||
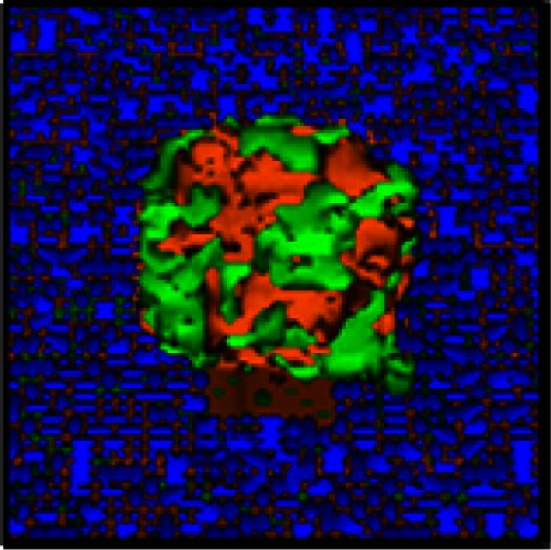
| High homotypic adhesion and high heterotypic adhesion | By 12 h, the spheroid has begun to disintegrate and the mesothelium has aggregated at the base of the spheroid | 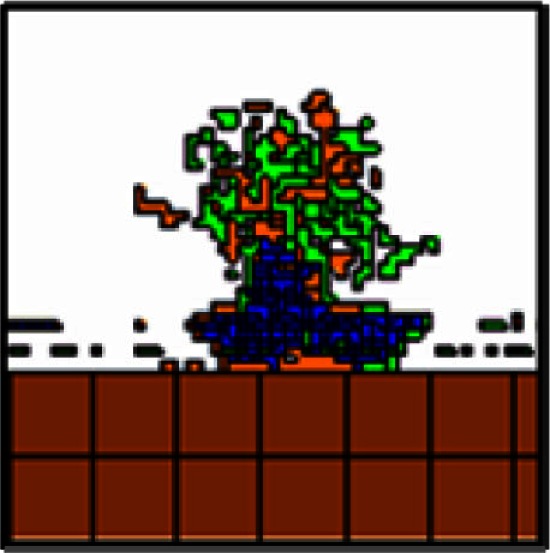 |
 |
||
| Cell type 1 | Cell type 2 | Adhesion 1 ⇔ 2 | |||
| PTC | PTC | 0 | |||
| PTC | other | 0 | |||
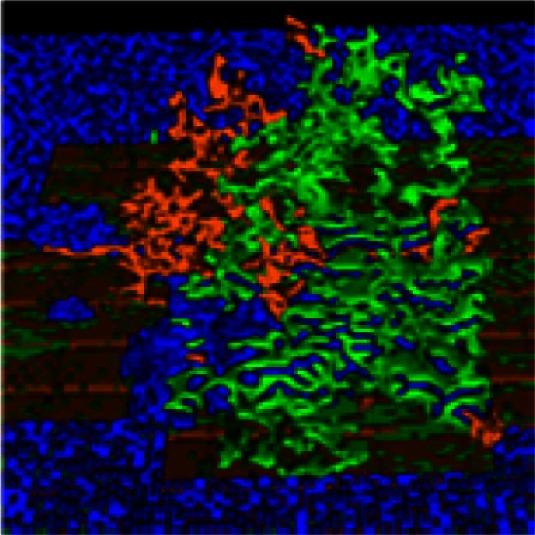
| High homotypic adhesion and low heterotypic adhesion No surface area constraint | At 24 h, a coherent spheroid with a similar appearance to the SKOV3.ip1 in vivo tumors can be seen. The mesothelium remains intact. However, cells are abnormally convoluted | 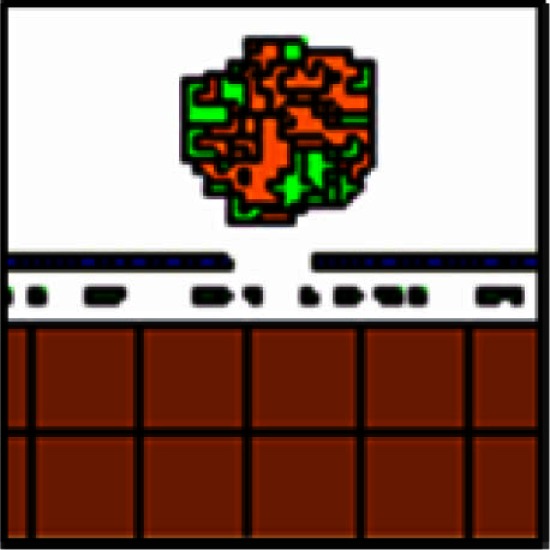 |
 |
||
| Cell type 1 | Cell type 2 | Adhesion 1 ⇔ 2 | |||
| PTC | PTC | 0 | |||
| PTC | other | Tested 10 and 20 | |||
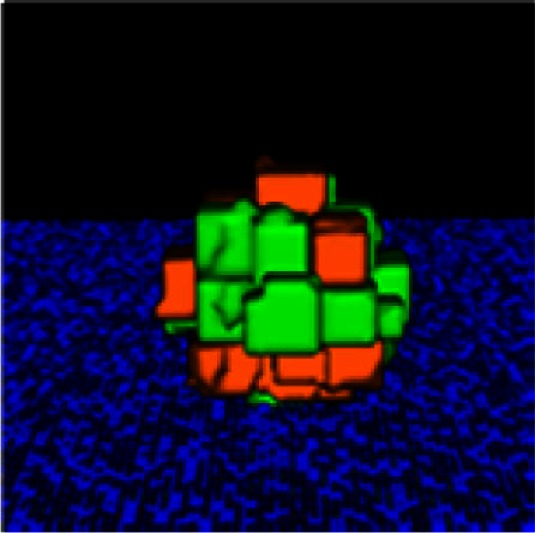
| High homotypic adhesion and low heterotypic adhesion Additional surface area constraint | This model most closely approximates the shape of SKOV3.ip1 spheroids and cells in vivo as shown at 12 h | 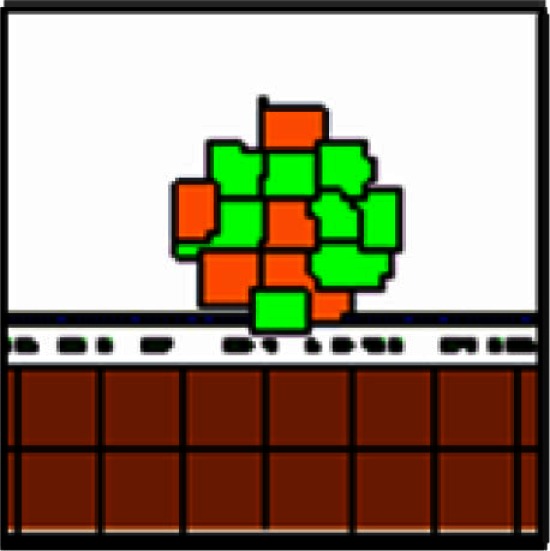 |
 |
||
| Cell type 1 | Cell type 2 | Adhesion 1 ⇔ 2 | |||
| PTC | PTC | 0 | |||
| PTC | other | See Table 2 | |||
Abbreviations are the same as in Table 2.