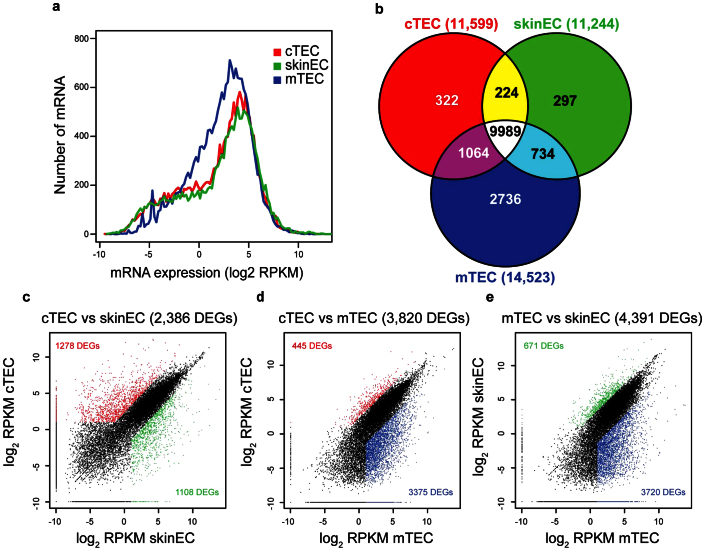
Figure 2. Differential gene expression in cTECs, mTECs and skin ECs.
(a) Frequency distribution of transcript expression levels. Gene expression levels (log2 RPKM) are plotted on the X-axis, whereas the Y-axis represents the frequency distribution of mRNAs calculated for 0.2 bin increments. The transcripts that were not detected by RNA-seq are not displayed in the representation. (b) Venn diagram showing the overlap and discrepancies between genes expressed (RPKM ≥ 2) in the three cell populations. Numbers in parentheses indicate the total number of genes expressed in each cell type. (c–e) Scatter plots representation of gene expression levels in (c) cTECs vs. skin ECs, (d) cTECs vs. mTECs and (e) mTECs vs. skin ECs. Color dots represent DEGs (RPKM ≥ 2 and fold-difference ≥ 5) which were overexpressed in cTECs (red), mTECs (blue) or skin ECs (green).

