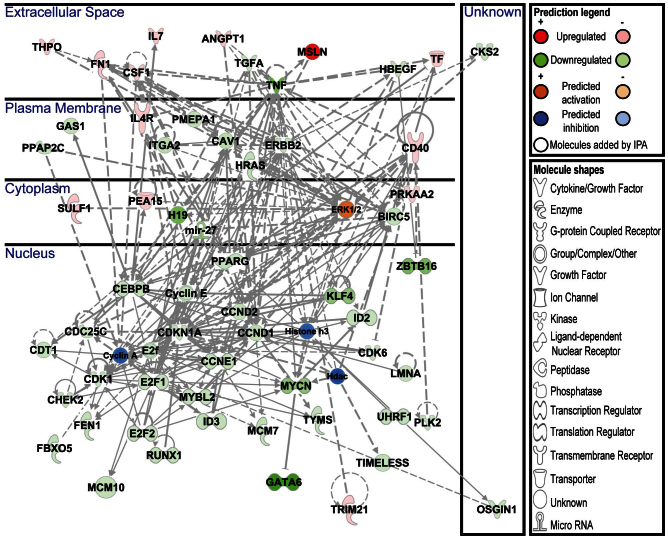
Figure 8. IPA-based network of cTEC vs. skin EC DEGs involved in S phase.
The network displays interactions between genes regulating S phase that were differentially expressed in cTECs vs. skin ECs. Solid and dashed lines indicate direct and indirect interactions, respectively. Genes up-regulated in cTECs are coloured in shades of red; genes down-regulated in cTECs are coloured in shades of green. Genes in white circles were not in our DEG dataset but were inserted by IPA because they are connected to this network. The activity of molecules highly connected to this network (hubs) was assessed with the IPA molecule activity predictor. Blue coloured molecules are predicted to be inhibited (or to have decreased activity) and orange coloured molecules to be activated (or to have increased activity) in cTECs relative to skin ECs.

