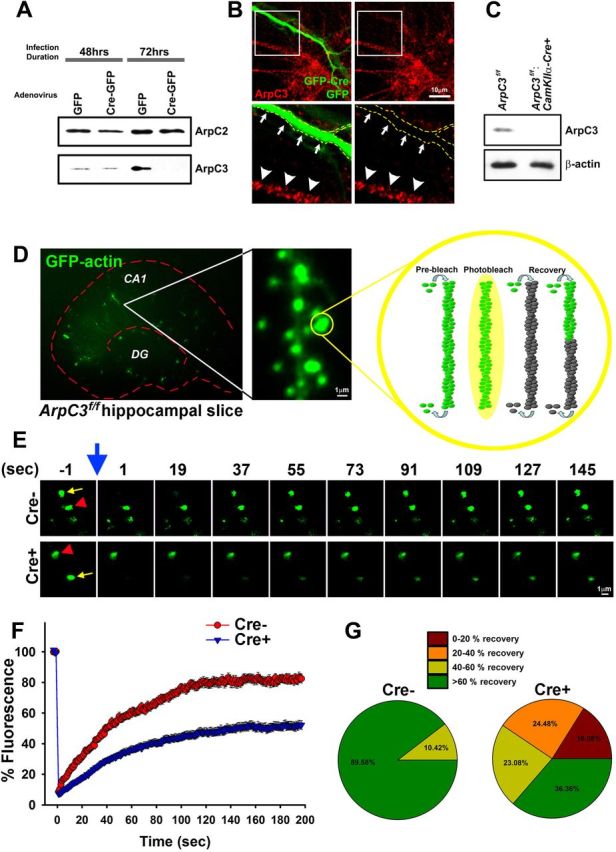
Figure 1.

Reduced spine actin dynamics upon loss of ArpC3. A, Mouse embryonic fibroblasts (MEFs) were cultured from e13.5 ArpC3f/f embryos and infected with either GFP or GFP-Cre adenovirus. Western blot analysis of lysates 48 and 72 h after infection confirmed the specific loss of ArpC3 at 72 h after infection (bottom), but not the related ArpC2 (top). B, Primary hippocampal neurons from ArpC3f/f mice were cultured and transfected with GFP-Cre or GFP (soluble fill). Seventy-two hours after transfection, neurons were immunostained for ArpC3 (red), which showed a punctate staining pattern within the cell body and neurites. GFP-Cre positive neuron (boxed region and outline) was negative for ArpC3 immunoreactivity. C, Synaptosomes purified from ArpC3f/f or ArpC3f/f:CaMKIIa-Cre mice were immunoblotted for ArpC3 (top) or β-actin as a loading control (bottom). D, Image of a hippocampal slice containing GFP-actin transfected neurons (left). GFP-actin is highly enriched in dendritic spines (middle). Schematic of photobleaching followed by recovery (right) illustrating that fluorescent recovery mainly depends on the turnover of existing actin filaments and reincorporation of freely-mobile unbleached GFP-actin monomers. E, Representative image montages of Cre− (top) and Cre+ (bottom panel) spines before and after (blue arrow) photobleaching (indicated by yellow arrows, unbleached spine is indicated by red arrowheads). F, Graph depicting average fluorescence recovery for Cre− and Cre+ spines. G, Average fraction of spines (last 30 s) that recover, binned by extent of recovery, from 0 to >60% recovery. Scale bars are indicated in each micrograph.
