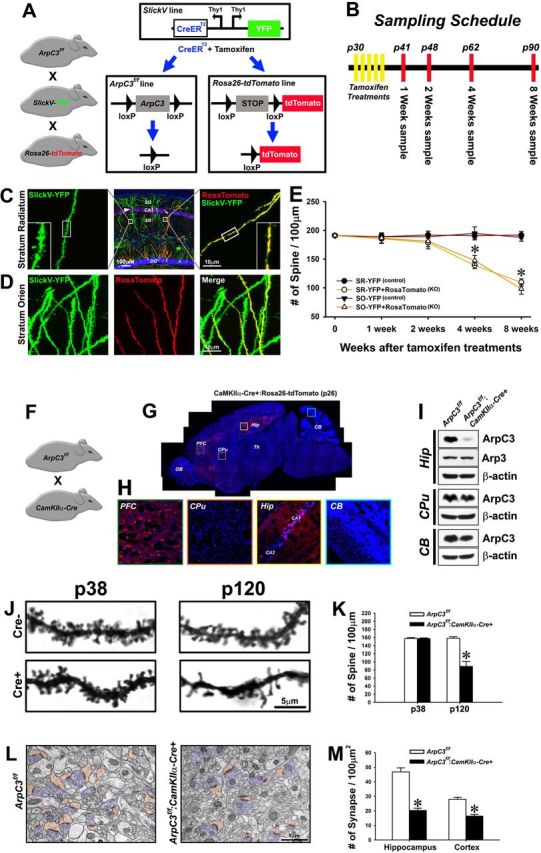
Figure 2.

Progressive loss of dendritic spines upon ArpC3 deletion. A, Schematic of triple mutant ArpC3f/f:SlickV-YFP:Rosa26-lox-stop-lox-tdTomato mice. Induction of Cre activity with tamoxifen treatment induces deletion of ArpC3 and a lox-stop-lox cassette to label neurons that have lost ArpC3 with tdTomato. Neurons lacking Cre activity are only labeled with YFP. B, Timeline for experiments in the triple mutant mice showing the time-points for tamoxifen treatments and tissue collection. C, Representative confocal images showing YFP (control, left) and YFP + tdTomato (cKO, right) dendritic sections from the same tissue (middle; 8 weeks after tamoxifen). Regions of hippocampus are indicated; SO, stratum oriens; SR, stratum radiatum; DG, dentate gyrus. D, Representative confocal images of dendritic sections from stratum oriens, showing YFP (left), tdTomato (Cre-positive; middle), and merge (right), indicating the selective loss of spines in Cre-expressing neuron (8 weeks after tamoxifen). E, Graph of spine density 1–8 weeks after tamoxifen treatment for control (YFP) and cKO (YFP+tdTomato) neurons from CA1 stratum radiatum (SR; n = 11–15 neurons for each genotype and time-point) and stratum oriens (SO; n = 9–16 neurons for each genotype and time-point) hippocampal regions. Two-way ANOVA for the numbers of spines revealed a significant main effect of time after Cre induction (F(3,189) = 22.42, p < 0.001) and group (F(3,189) = 43.82, p < 0.001), and a significant time × group interaction (F(9,189) = 7.99, p < 0.001). Bonferroni-corrected pairwise comparisons noted that there were no significant differences in spine number among the four groups over the first 2 weeks after tamoxifen treatment. However, at 4 and 8 weeks the numbers of spines were significantly reduced in both SR and SO hippocampus in Cre+ neurons compared with those in Cre− control neurons (*p < 0.001, from respective controls). F, ArpC3f/f:CaMKIIa-Cre mouse line. G, Representative sagittal section from CaMKIIα-Cre:Rosa26-lox-stop-lox-tdTomato mouse at P26. tdTomato expression (red), a marker of Cre activity, and DAPI nuclear stain (blue) are shown. H, Boxed regions are expanded in G for the prefrontal cortex (PFC), caudate–putamen (CPu), hippocampal CA1 and CA2 (Hip), and cerebellum (CB) regions. OB, Olfactory bulb; Th, thalamus. I, Representative immunoblots from Cre+ (Hip) and Cre− regions (CPu, CB) for ArpC3, Arp3, and β-actin. Residual ArpC3 is likely to reflect Cre− hippocampal glia and interneurons. J, Visualization of spines from ArpC3f/f:CaMKIIa-Cre mice compared withArpC3f/f controls by Golgi stain at P38 and P120. K, Graph of spine density at P38 and P120. Independent t test showed no difference of spine density between cKO mice and littermate controls in P38 brains. However, P120 cKO mice showed a significant decrease of spine density compared with their littermate controls (t(1,4) = 6.71, p < 0.01), *p < 0.01, from controls at P120. L, Representative electron micrographs showing postsynaptic spines (orange) and presynaptic butons (blue) in control and cKO CA1 hippocampus at P120. M, Graph compares density of spine synapses in control and cKO sections from hippocampus [Cre− (n = 283 axospinous synapses from 29 micrographs); Cre+ (n = 196 axospinous synapses from 46 micrographs), and cortex [Cre− (n = 181 axospinous synapses from 31 micrographs); Cre+ (n = 113 axospinous synapses from 33 micrographs). *p < 0.001, from respective controls. Scale bars in each micrograph are indicated.
