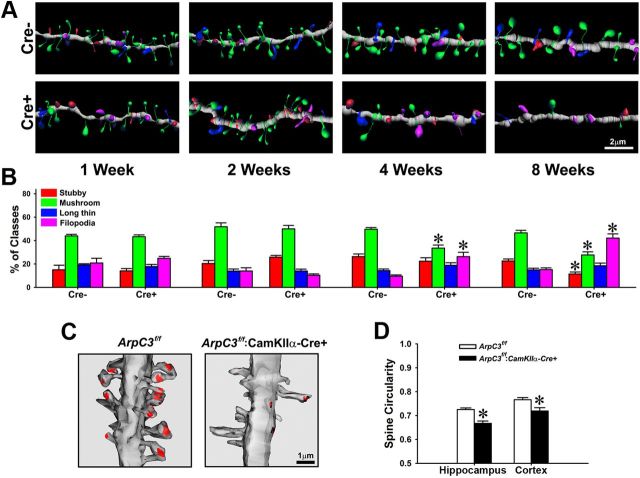
Figure 4.
Altered spine morphology in ArpC3 cKO neurons. A, Reconstructed images from control (Cre−) and cKO (Cre+) dendrites 1–8 weeks after tamoxifen treatment from ArpC3f/f:SlickV-YFP:Rosa26-lox-stop-lox-tdTomato neurons. Morphology of individual spines is color-coded according to the key in B. B, Graph depicting the percentage of each morphological class of spine over time after tamoxifen-mediated Cre induction. ANOVA with repeated measure revealed significant main effects of spine-type (F(3,288) = 178.7, p < 0.001), spine-type × genotype (F(3,288) = 21.375, p < 0.001), spine-type × time (F(9,288) = 10.76, p < 0.001), and spine-type × genotype × time (F(9,288) = 8.18, p < 0.001). However, an interaction between genotype × time was not detected. Bonferroni-corrected pairwise comparisons noted that there were no significant differences in spine classes between genotypes over the first 2 weeks after tamoxifen treatment. However, at 4 weeks, mushroom-shaped spines in YFP+tdTomato double positive KO neurons were selectively decreased, whereas, filopodia-like spines were significantly increased compared with YFP single positive control neurons (*p < 0.001). At 8 weeks after tamoxifen treatment, stubby and mushroom spines in YFP+tdTomato double positive KO neurons were significantly decreased, whereas, filopodia-like spines were significantly increased compared with YFP single positive control neurons (*p < 0.001). n = 13–15 neurons per genotype were used for each time-point. C, Three-dimensional EM reconstructions of hippocampal dendrites from ArpC3f/f (control, left) and ArpC3f/f:CaMKIIα-Cre (cKO, right) mice showing representative differences in overall spine morphology and density. Postsynaptic density (PSD) is indicated in red. D, Graph depicting the spine head circularity computed from electron micrographs from control ArpC3f/f and cKO ArpC3f/f:CaMKIIα-Cre mice; 1.0 corresponds to a perfect circle. Hippocampus (n = 283 for ArpC3f/f control, n = 196 for ArpC3f/f:CaMKIIα-Cre, *p < 0.001, from control). Cerebral cortex (n = 181 for ArpC3f/f control, n = 113 for ArpC3f/f:CaMKIIα-Cre, *p < 0.01, from control. Scale bars in each micrograph are indicated.

