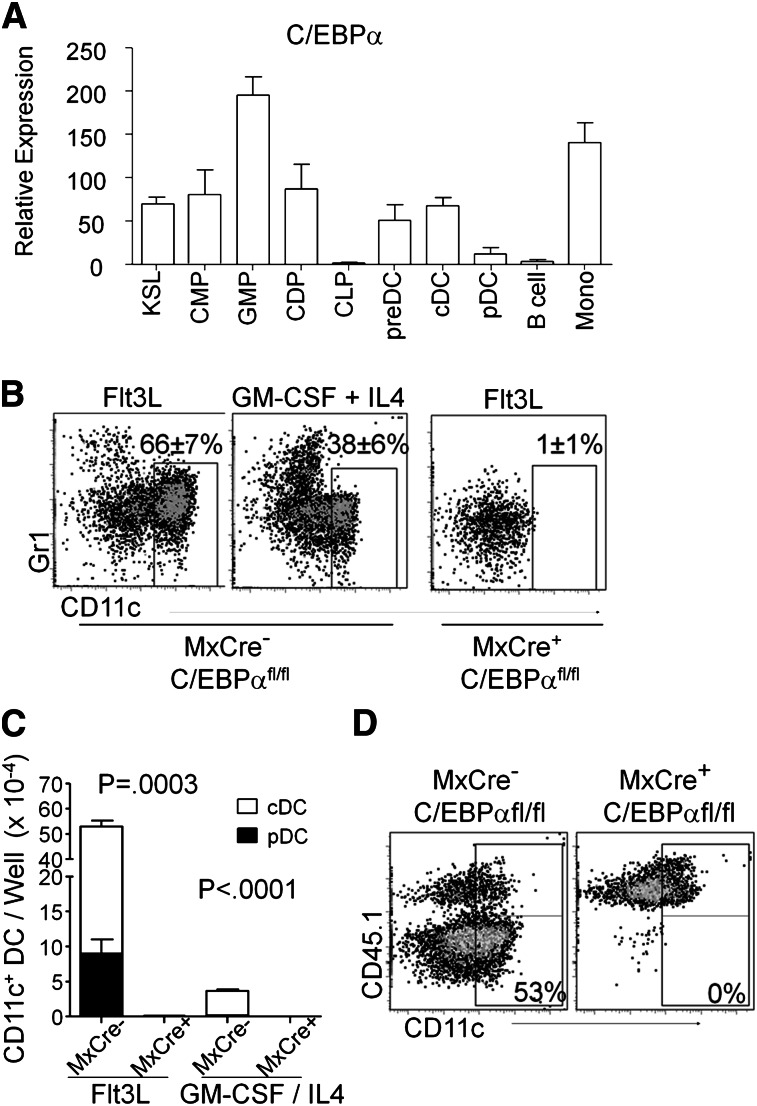
Figure 1.
Expression of C/EBPα in DC and DC progenitors. (A) Relative quantitative RT-PCR of RNA from sorted KSL (cKitHi, Sca1+, Lin–), CMP (Lin–, Sca1–, cKitHi, CD34+, FcγRII/III–/lo), GMP (Lin–, Sca1–, cKitHi, CD34+, FcγRII/IIIhi), CDP (Lin–, cKitlo, Flt3+, CD115+, CD11c–), preDC (Lin–, B220–/lo, CD11c+, MHCII–, CD11b/Mac1–), cDC (CD19–, CD3–, NK–, B220–, CD11c+, MHCII+), pDC (CD19–, CD3–, NK–, B220+, CD11clo/+, PDCA-1+), B (CD19+, B220+ splenic B cells), and monocytes (CD19–, CD11b/Mac1+, Gr-1+ peritoneal monocytes) to assess expression of C/EBPα. Values are presented relative to that of β2-microglobulin RNA. Data are averages of 4 independent experiments (error bars represent SD). (B) DC loss after deletion of C/EBPα. 106 lysed, WBM cells from poly(IC)-injected MxCre– C/EBPαfl/fl or MxCre+ C/EBPαfl/fl mice were cultured in Flt3L-supplemented media. After 8 days, viable cells were assessed for relative expression of CD11c and Gr1 using flow cytometry. These representative plots show the impact of C/EBPα deletion on the presence of DC (CD11c+). The Gr-1+ myeloid cells can also be seen in these plots. GM-CSF and IL4 cultures with MxCre+ C/EBPαfl/fl WBM cells resulted in no viable cells after 9 days of culture (FACS plot not shown). (C) Shown are the numbers of total live CD11c+ DCs present in the FL or GM-CSF/IL4 cultures for pDC (black, B220+) and cDC (white) from (B). The numbers were generated by hemocytometer counts combined with flow cytometry analysis. These numbers of DCs represent mean ± SD from these 4 experiments where MxCre– and MxCre+ correspond to MxCre– C/EBPαfl/fl and MxCre+ C/EBPαfl/fl cells, respectively. (D) Flow cytometric analysis showing CD45.2+ Mx1-Cre+ C/EBPαfl/fl or C/EBPαfl/fl. WBM cells were cultured together with equal numbers of CD45.1+ BM cells and Flt3L (200 ng/mL) for 8 days. Similarly, cultured cells were stained for cell surface markers CD45.1, CD45.2, CD11c, and MHCII followed by flow cytometry and cell counts. DCs derived from WBM were identified as CD45.2+ CD11c+ Gr1–. The data shown are representative dot plots from 4 experiments with similar results.

