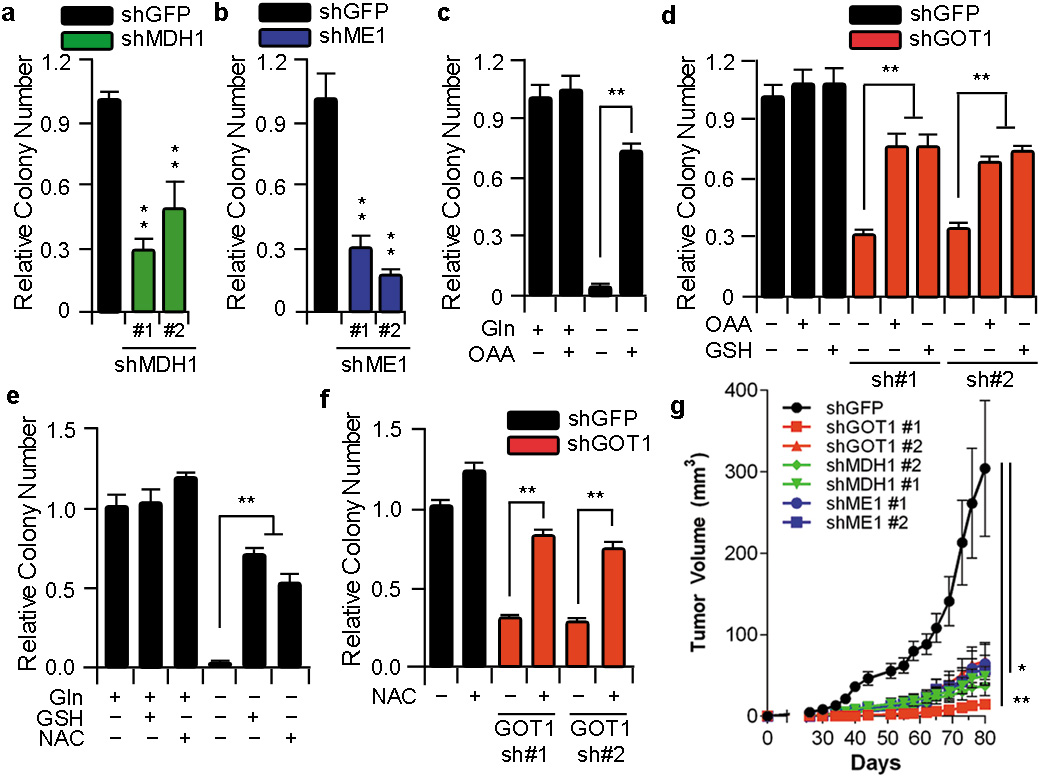
Figure 3. Metabolism of the Gln carbon skeleton through GOT1, MDH1 and ME1 supports PDAC growth by maintaining redox balance.
a and b, Relative clonogenic growth of 8988T cells expressing a control shRNA (shGFP) or two independent shRNAs to MDH1 or ME1. c and e, Relative clonogenic growth of 8988T cells under conditions indicated. Cells were plated in complete culture media (10mM glucose and 2mM Gln), which was replaced the following day with Gln-free medium supplemented with OAA (4mM), GSH (4mM) or N-acetylcysteine (NAC) (4mM). d and f, Relative clonogenic growth of 8988T cells expressing a control shRNA (shGFP) or two independent shRNAs to GOT1 with or without OAA (4mM), GSH (4mM) or NAC (4mM). Error bars represent the s.d. of triplicate wells from a representative experiment. g, Xenograft growth of 8988T cells expressing a control shRNA (shGFP), shRNAs to GOT1 (#1 and #2), MDH1 (#1 and #2) or ME1 (#1 and #2) in mice. Error bars represent s.e.m (n=10). *, p< 0.05; **, p< 0.01.

