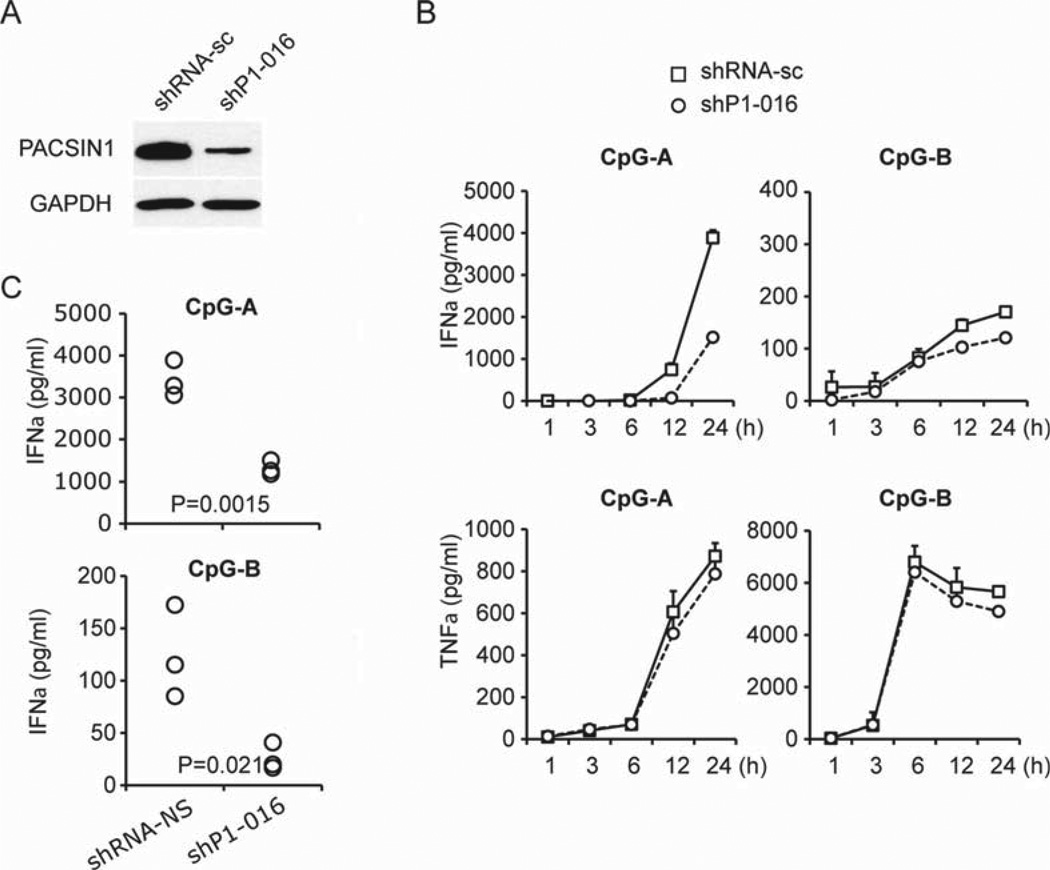
Figure 2. Effects of PACSIN1 knockdown on the response to TLR9 ligands.
(A) Gen2.2 cells were transduced with scrambled shRNA (shRNA-sc) or shRNA targeting PACSIN1 (shP1–016). The knockdown effect of PACSIN1 was confirmed by western blot and GAPDH was used as a loading control. Representative result from one of three independent experiments is shown. (B) shRNA transduced Gen2.2 cells were stimulated with 1 µM CpG-A (left panel) or 0.5 µM CpG-B (right panel) for 1 h, 3 h, 6 h, 12 h, 24 h. Levels of IFN-α, TNF-α, and IL-6 in the culture supernatants were measured by ELISA. Results are from one experiment representative of three. Error bars show mean+SD of triplicates. Statistical analysis was performed using an unpaired two-tailed Student’s t-test. (C) Levels of IFN-α production at 24 h stimulation with CpG-A (upper) or CpG-B (lower) in PACSIN1-knockdown or control Gen2.2 cells were measured by ELISA. Each symbol represents one independent experiment.

