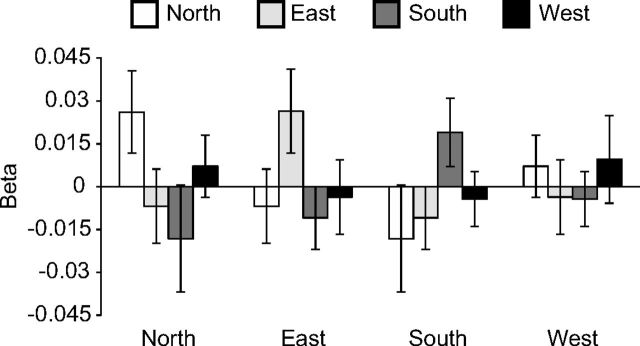
Figure 6.
Direction tuning curves for right presubiculum. β weights, reflecting the average correlation between multivoxel patterns elicited by views in one scan run and patterns elicited by views in the complementary scan run, are plotted as a function of the facing directions of the views. For example, for a given North view, the average correlation was calculated between the pattern for that view and the pattern for all other views facing to the North, East, South, and West (excluding pairs of views obtained at the same intersection); these values were then grouped by direction to give average correlation values for North-North, North-East, North-South, and North-West. Note that there are peaks at North-North, East-East, and South-South, indicating that right presubiculum distinguishes the same versus different direction for North, East and South. Error bars indicate mean ± SEM.

