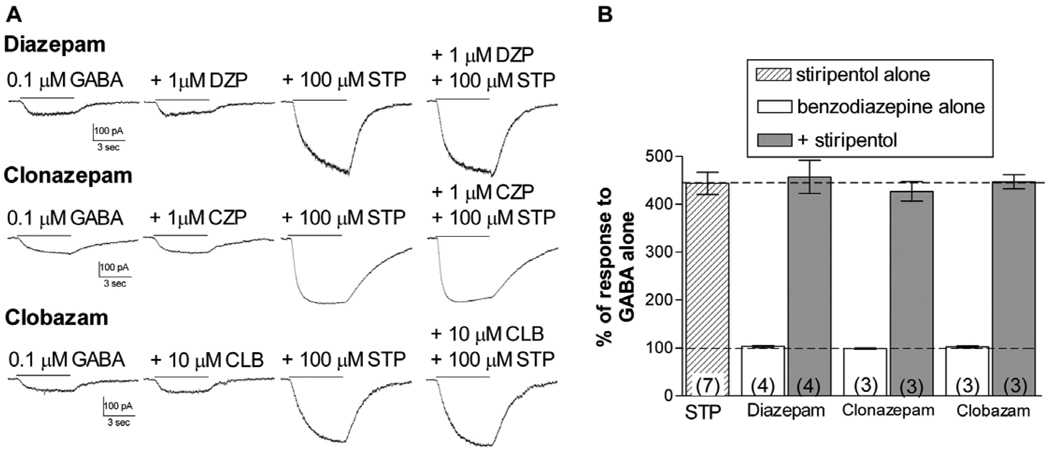
Figure 3. δ-containing receptors.
A. Representative whole-cell traces from cells transfected with α3, β3, and δ subunits, showing the current response to GABA alone or GABA + the modulator(s) indicated. Drugs were applied for 5 sec as indicated by the solid line to transfected cells voltage-clamped at -50 mV.
B. Bars represent the mean potentiation (± S.E.M.). Dashed lines indicate the response to GABA alone (100%) or the response to stiripentol alone. Addition of the benzodiazepine did not increase the response to GABA or influence the ability of stiripentol to modulate these receptors

