Fig. 3.
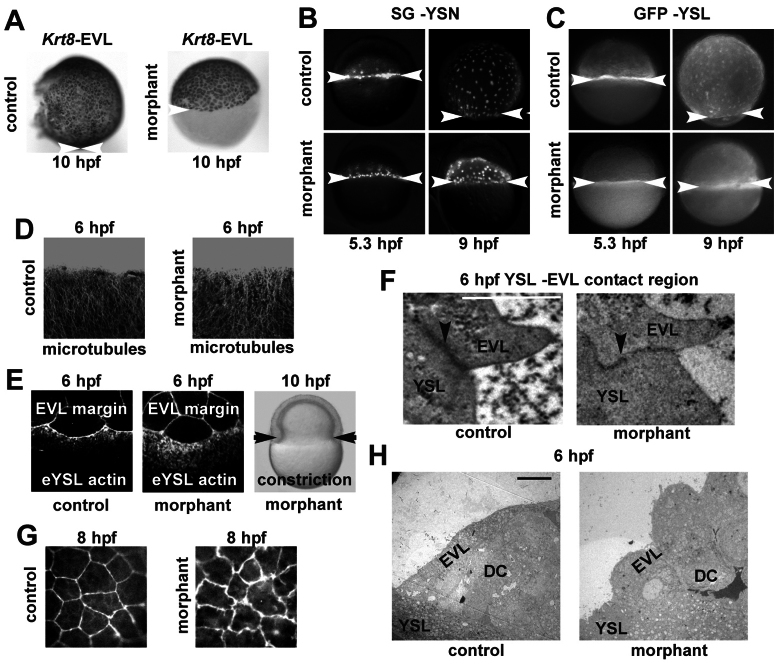
Syntenin-a regulates the epiboly of the EVL and the YSL and impacts their cytoskeleton. (A) WISH at 10 h.p.f., using the krt8 probe, illustrating the epibolic arrest of the EVL in class III syntenin-a morphants. (B,C) Fluorescence micrographs of embryos injected at 4 h.p.f. with Sytox Green (B) or GFP RNA (C) into the YSL, and observed at 5.3 h.p.f. and 9 h.p.f. Note the block of YSN (B) and YSL (C) progression in syntenin-a morphants. (D) Images corresponding to superimposed Z-stacks obtained by confocal microscopy with antibodies against tubulin and illustrating that the tubulin network is similar in controls and syntenin-a morphants at 6 h.p.f. (E) Confocal micrographs (left and middle) showing Rhodamine–Phalloidin staining of punctate actin band present in the eYSL. Note that the actin band in syntenin-a morphants displays a broadening. However, constriction can occur as shown in right image, black arrows. (F) Transmission electron micrograph of the contact region between EVL and YSL (black arrowhead). Well-defined EVL–YSL junctions are observed in both control and morphant. Scale bar: 1 μm. (G) Confocal micrographs of the actin architecture in the EVL by Rhodamine-Phalloidin staining at 8 h.p.f. illustrating that EVL cells in syntenin-a morphant display irregular shapes and multiple protrusions (white arrows). (H) Transmission electron micrographs showing the roundness of the EVL cells in morphants compared with controls. Scale bar: 10 μm. White arrowheads indicate the margin of the EVL (A), YSN (B) and YSL (C).

