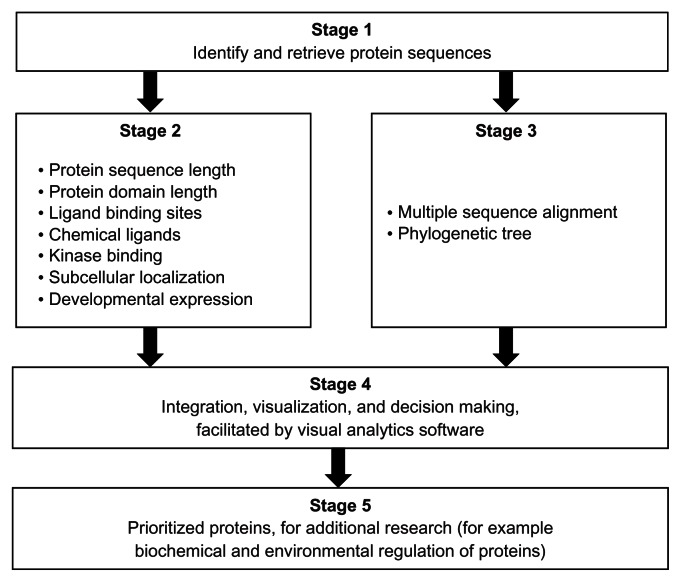
Figure 1.
Overview of a set of bioinformatics and visual analytics methods used to prioritize protein sequences for further research.
Notes: The core of the prioritization process is a visual analytics stage (Stage 4) that enables the interaction of researcher(s) with the results from the bioinformatics analyses (Stage 2 and Stage 3) of the protein sequences (Stage 1). The evolutionary relatedness of the protein sequences is based on statistically supported groups in a phylogenetic tree that is derived, in turn, from the multiple sequence alignment of all the sequences (Stage 3). Additional evidence for evolutionary relatedness is obtained from the gene synteny on the chromosomal regions. The protocol can be particularly suited for identifying orthologous proteins with shared patterns of sequence and functional annotations (Stage 5). In the context of schistosomiasis parasites from different regions of the world, the identified proteins could be targets for understanding shared biological processes during the life cycle of parasites. Details of each method are available in the Methods section of the article.

