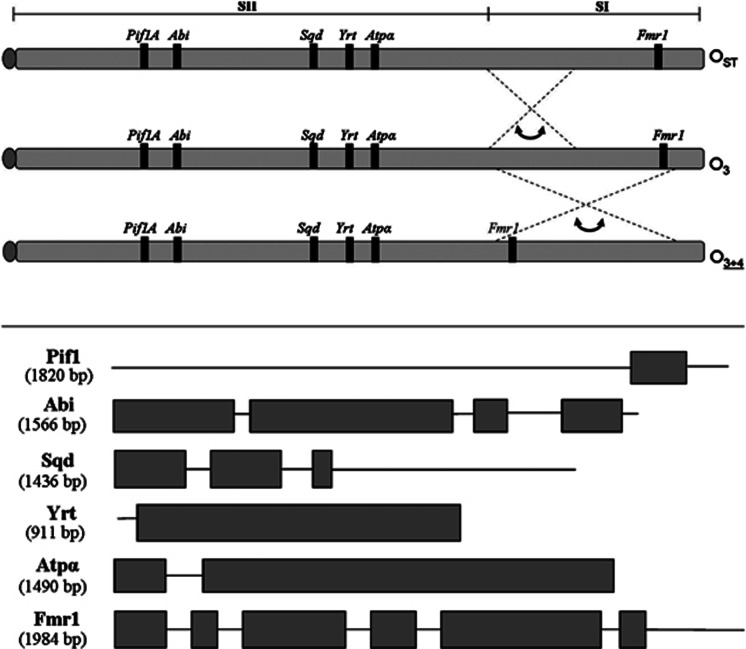
Figure 1.
Top: location of the six gene regions studied in the O3+4 and OST arrangements in comparison with the ancestral O3 arrangement. The O-chromosome is divided in sections SI and SII, where SI is the fragment covered by the overlapped inversions O3+4. Bottom: sequenced fragment for each locus. Exonic regions are identified using gray boxes, and intronic regions are represented by lines. For each gene, the size of the sequenced fragment is given in parentheses.

