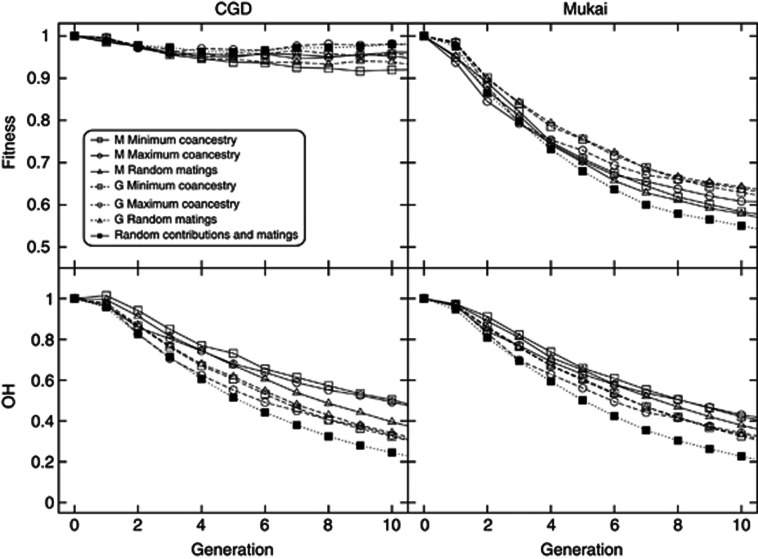
Figure 4.
Management for a population of Np=10 at t=0 and K=5000 under the CGD and Mukai scenarios with 1000 selected loci. Observed heterozygosity averaged over all neutral loci that are initially polymorphic and mean fitness, plotted against management generations using molecular (M) or genealogical (G) coancestry and different mating strategies. The results show averages over 100 replicates, and the maximum standard deviation in mean fitness is 0.05 at t=0 and 0.07 at t=10, and in observed heterozygosity at neutral sites initially segregating is 0.001 at t=0 and 0.004 at t=10.

