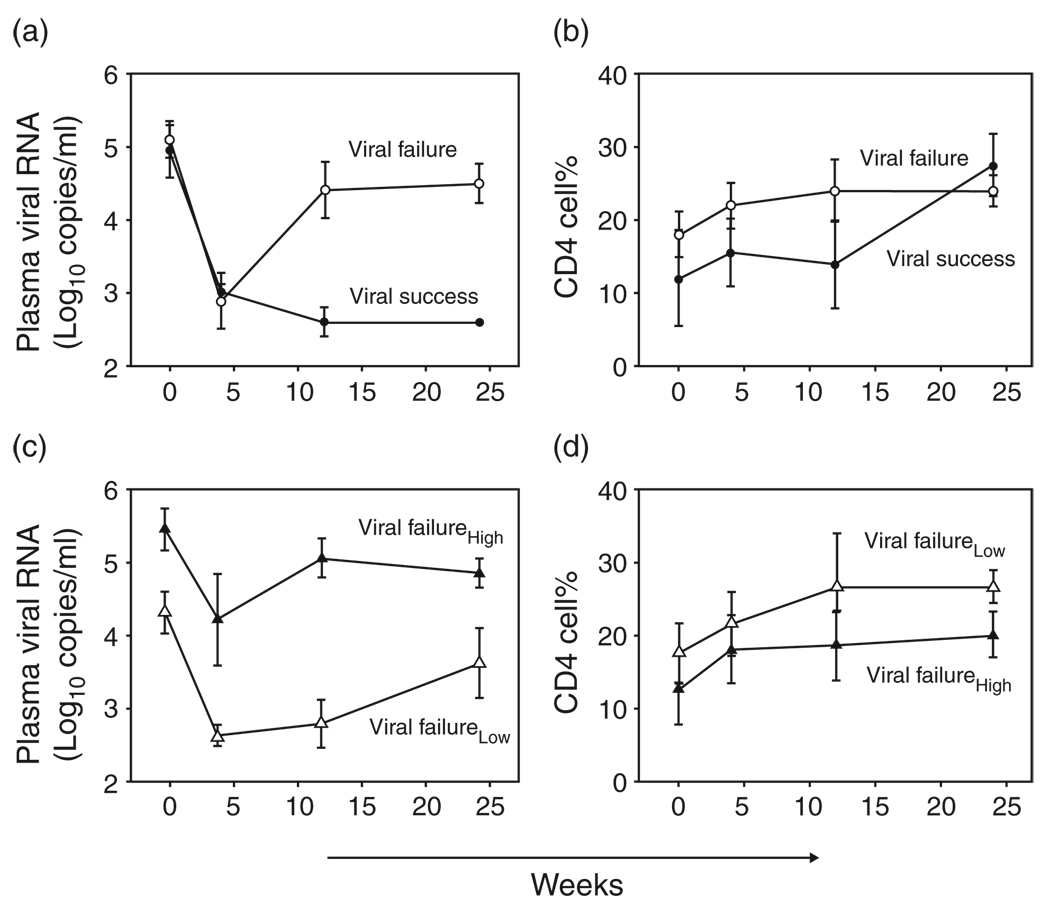
Fig. 1. Viral and immune responses over 24 weeks of combination antiretroviral therapy.
(a) Viral response to therapy for viral failures (open circles) and viral successes (filled circles). Median plasma viral RNA (log10 copies/ml) is shown on the y-axis. Weeks on therapy are shown on the x-axis. (b) Immune response to therapy for viral failures (open circles) and viral success (filled circles). Median CD4 cell percentage is shown on the y-axis. Weeks on therapy are shown on the x-axis. (c) Viral response to therapy for viral failure patients with low fit viruses (open triangles) and high fit viruses (filled triangles). Median plasma viral RNA (log10 copies/ml) is shown on the y-axis. Weeks on therapy are shown on the x-axis. (d) Immune response to therapy for viral failure patients with low fit viruses (open triangles) and high fit viruses (filled triangles). Median CD4 cell percentage is shown on the y-axis. Weeks on therapy are shown on the x-axis. Error bars represent standard error of the mean.

