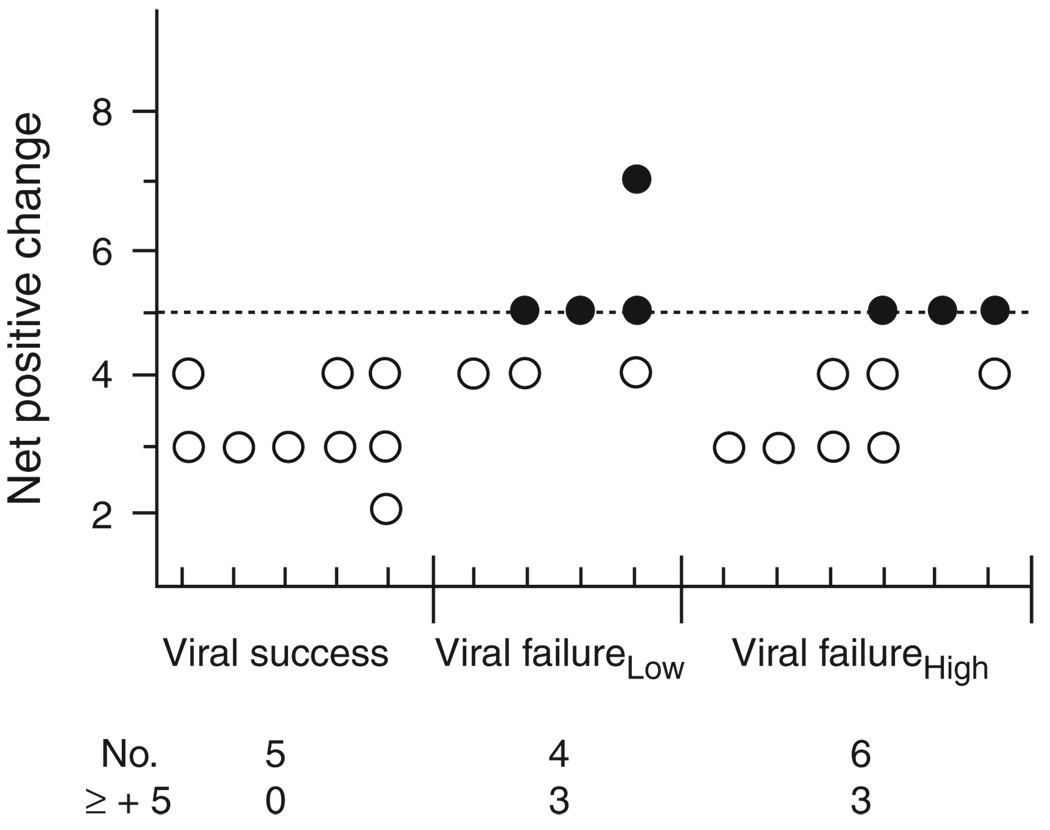
Fig. 2. Envelope V3 charge characteristics prior to therapy.
Net V3 charge of viruses present before therapy is shown on the y-axis, with response groups shown on the x-axis. Each tick mark on the x-axis summarizes V3 charge for one patient. Open circles represent low charge sequences and filled circles represent high charge sequences. The total number of patients and the number of patients with high charge (≥+5) viruses are noted below each response group.

