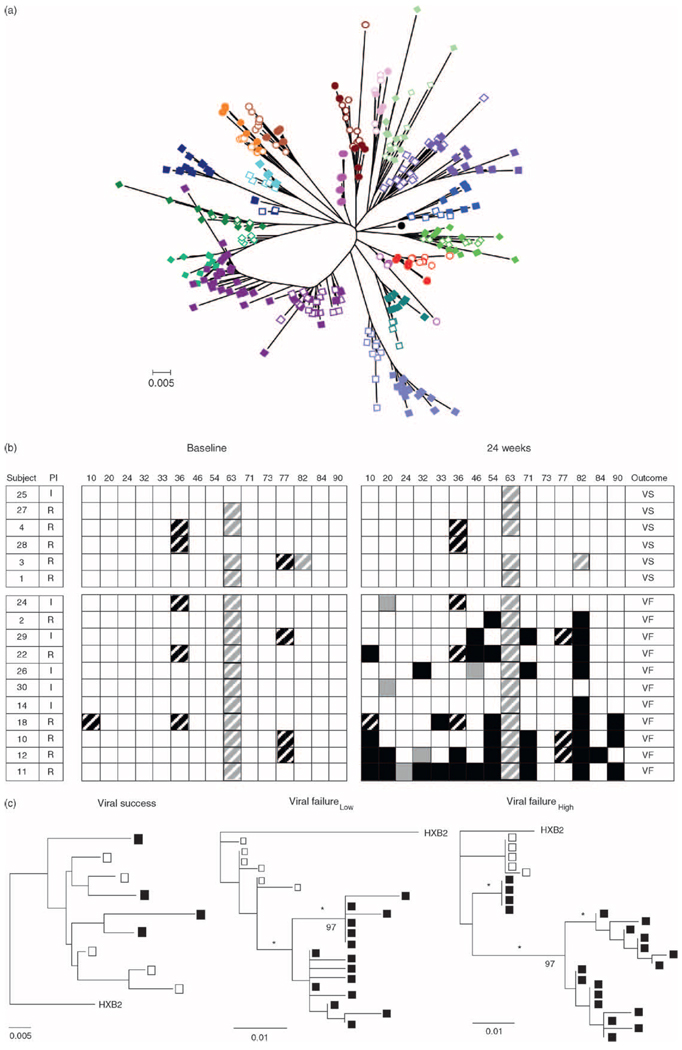
Fig. 3.
(a) Phylogenetic relationship of approximately 500 protease sequences among the cohort of patients. HIVHXB2 (●) was used as the outlier sequence. Each color represents one individual. Open symbols represent pretherapy sequences and closed symbols represent sequences after 24 weeks of therapy. Each branch represents an individual patient. ‘0.005’ indicates genetic distance (substitutions/site). (b) Protease genotypes at baseline and after 24 weeks of combination therapy. Patients are designated by numbers. Black box, new therapy-specific mutation; black-striped box, therapy-specific polymorphism; gray box, new therapy nonspecific mutation; gray-striped box, therapy nonspecific polymorphism; I, indinavir; R, ritonavir; white box, no polymorphism. In response to therapy, all patients were immune successes, and either viral success (VS) or viral failure (VF) with low fit (patients 24, 2, 29, 22, and 26) or high fit viruses (patients 30, 14, 18, 10, 12, and 11). (c) Representative phylogenetic relationship of protease sequences in a viral success subject (left panel), a viral failure low fit patient (center panel), and a viral failure high fit patient (right panel). Open symbols represent pretherapy sequences and closed symbols represent sequences after 24 weeks of therapy. HIVHXB2 was used as the outlier sequence. ‘0.005’ and ‘0.01’ indicate genetic distances. Numbers on the trees represent bootstrap values, and * indicates significant branch lengths.

