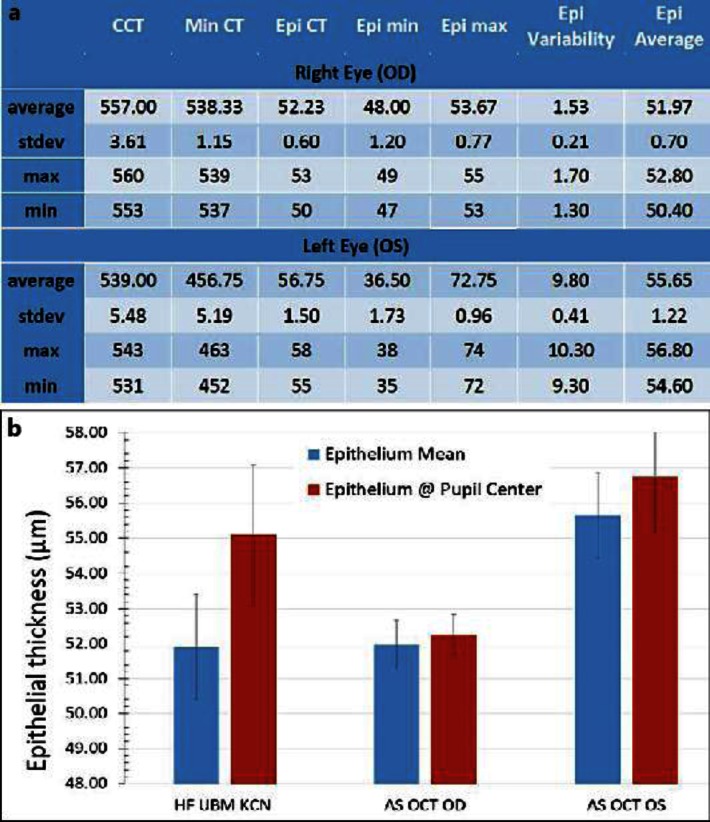
Fig. 2.
a Corneal and epithelial thickness measurements for OD and OS. Values correspond to averages from 4 AS-OCT acquisitions. All values are in micrometers. Mean and standard deviations are calculated for the 4 scans. CCT = Central corneal thickness; Min = minimum; Max = maximum; stdev = standard deviation; Min CT = minimum corneal thickness; Epi min = epithelial minimum thickness; Epi max = epithelial maximum thickness. b Graph showing epithelial thickness averages for the KCN group, as reported by Kanellopoulos et al. [1] using HF-UBM, and the respective epithelial thicknesses for OD and OS as measured by AS-OCT.

