
. 2013 May;14(3):263–270. doi: 10.5811/westjem.2012.9.11551
© 2013 Department of Emergency Medicine, University of California, Irvine
This is an open access article distributed in accordance with the terms of the Creative Commons Attribution (CC BY 4.0) License. See: http://creativecommons.org/licenses/by-nc/4.0/.
Figure 1.
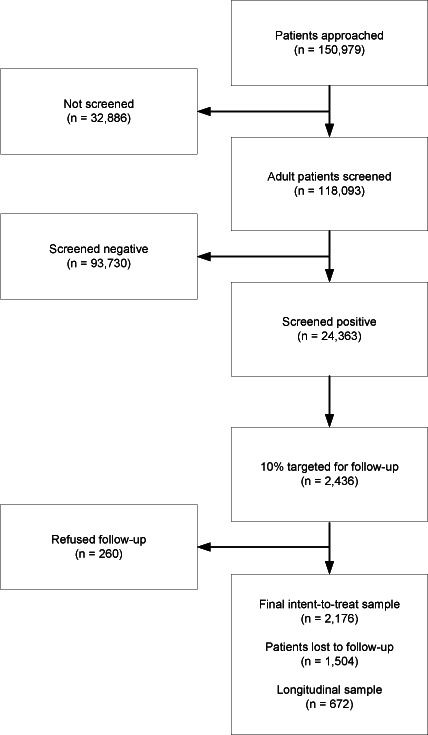
Chart showing formation of study sample.