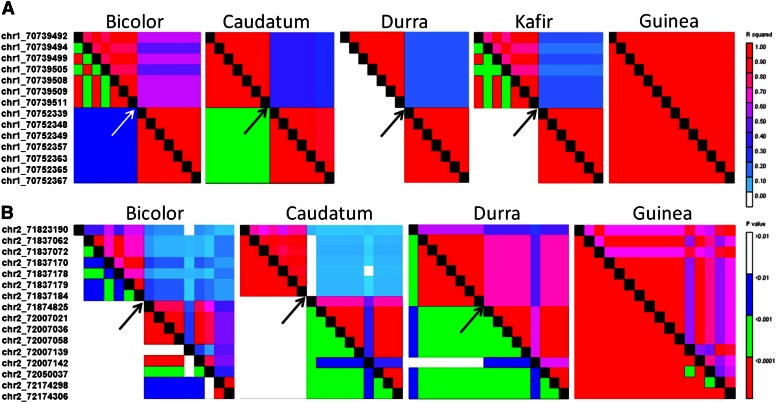
Figure 6.
Race-specific linkage disequilibrium blocks in sorghum. (A) SBI-01 LD block specific to race guinea. (B) SBI-02 LD block specific to race guinea. In each plot, p values are below the diagonal and r2 values are above. On the left of each panel are the SNP markers which are also on the X-axis of each plot. On the right is the scale for r2 and p values. Arrows indicate the point of LD breakdown in all races other than guinea. Race kafir is not shown in (B) because of a lack of polymorphic SNPs among accessions within the race in this genomic region.

