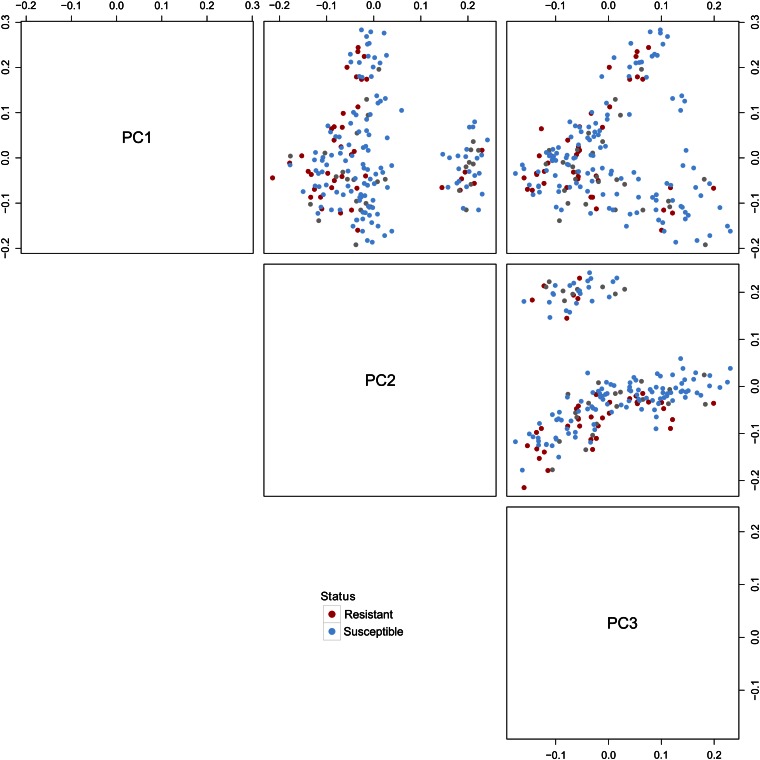
Figure 2.
Principal components revealing population stratification. All 194 individuals that passed quality control filtering are represented. Colonization-susceptible individuals from the case-control study are shaded blue and colonization-resistant birds shaded red. Gray circles represent individuals from the center of the colonization spectrum that were not used in the association study. All autosomal markers were used to construct a kinship matrix of genetic relatedness or identity by descent (IBD). This matrix was converted to a distance matrix and classical multidimensional scaling performed to detect any population substructure. There is evidence for some stratification of the population which was resolved by the first three principal components (PC1, PC2, and PC3). The percentage variation which is represented by each of these principal components is 18.6% (PC1), 16.8% (PC2), and 11.1% (PC3). The first two principal components reveal separation of the population into two subpopulations—one large group with 157 individuals and one smaller group of 37 individuals.

