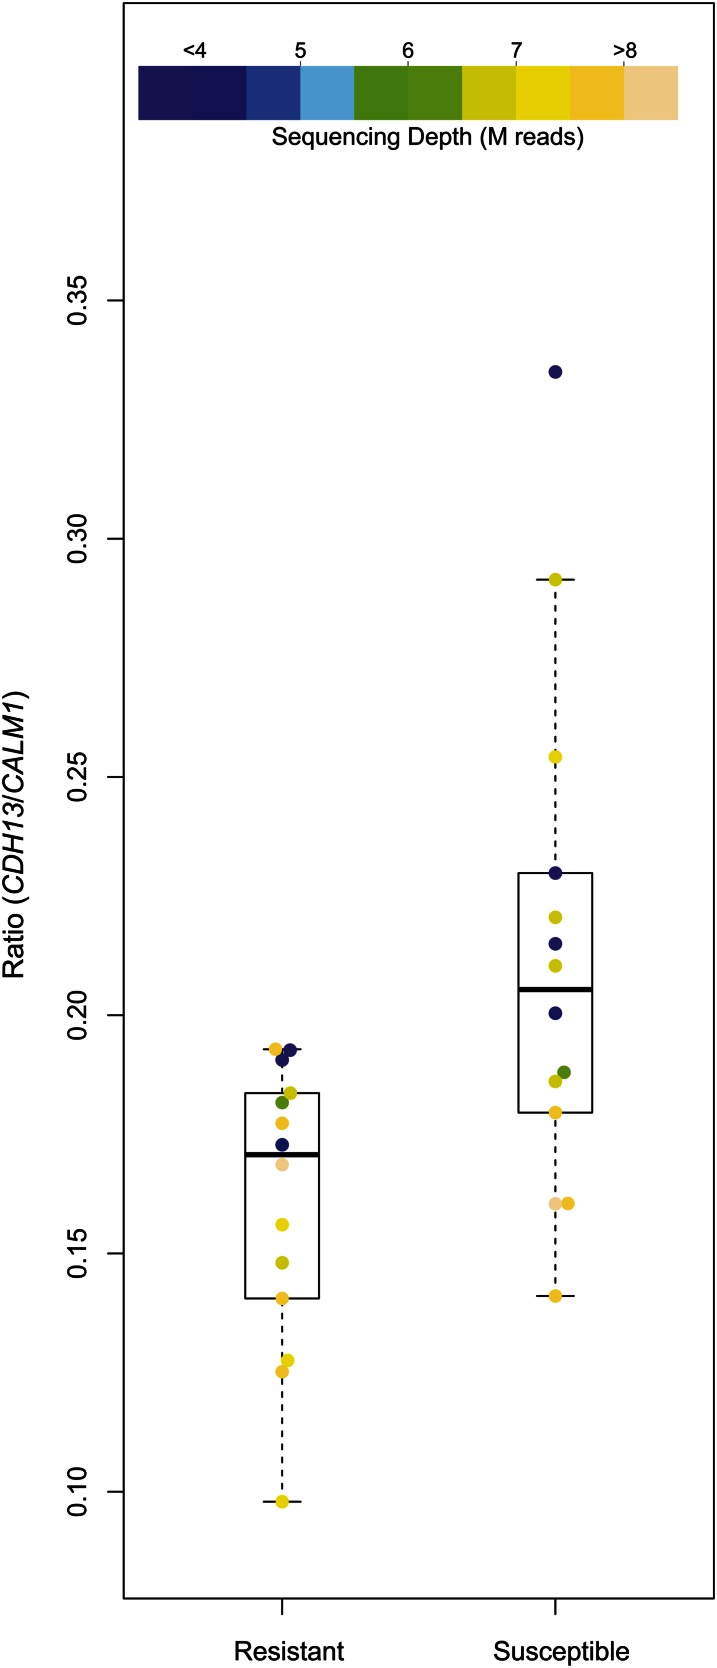
Figure 6.
Relative expression levels of CDH13 and CALM1. Boxplots of resistant vs. susceptible birds reveal separation of the population based on CDH13/CALM1 expression (Mann-Whitney U-test, P = 0.004) and no bias in relative ratios due to sequencing depth. The ratio of CDH13/CALM1 expression for all 28 transcriptionally profiled birds is plotted, with shading reflecting depth of sequencing.

