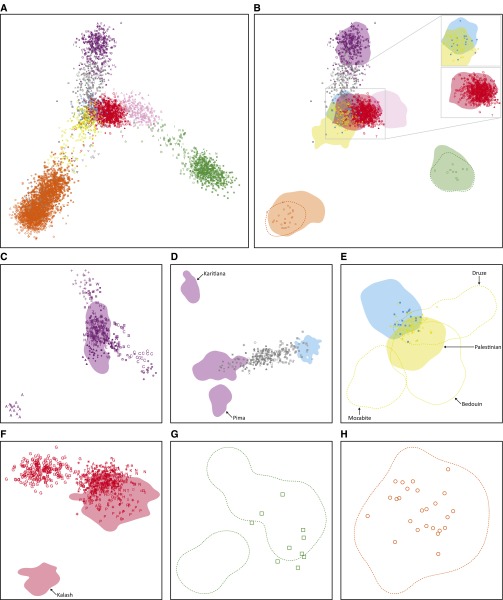
Figure 3.
Procrustes-transformed multidimensional scaling (MDS) representations of pairwise allele-sharing distances between individuals. (A) MDS plot of all individuals in the MS5435 data set, colored by geographic affiliation and indicated by the symbols defined in Figure 2. (B) MDS locations of selected individuals from the non-HGDP-CEPH data sets overlaid on utilization distributions for the HGDP-CEPH data set. The figure is a different graphical representation of the MDS coordinates in A. Inset, the Jewish data set in relation to the HGDP-CEPH Middle Eastern and European samples (top), and the Asian Indian and CGP data sets in relation to the HGDP-CEPH Central/South Asian samples (bottom). (C) MDS plot of 325 Native American individuals in the Native American data set and 64 HGDP-CEPH Native American individuals. (D) MDS plot of 241 individuals in the Latino data set and 64 HGDP-CEPH Native American and 158 HGDP-CEPH European individuals. (E) MDS plot of 77 individuals in the Jewish data set and 158 HGDP-CEPH European and 163 HGDP-CEPH Middle Eastern individuals. (F) MDS plot of 610 Asian Indian individuals in the Asian Indian and CGP data sets and 200 HGDP-CEPH Central/South Asian individuals. All HGDP-CEPH Kalash samples lie in the bottom-left shaded area; all other HGDP-CEPH Central/South Asian samples lie in the top-right shaded area. (G) MDS plot of 10 East Highlands individuals in the Pacific Islander data set and 17 HGDP-CEPH East Highlands individuals. The bottom-left contour contains four HGDP-CEPH individuals (540, 545, 546, and 547); all other HGDP-CEPH individuals lie in the top-right contour. (H) MDS plot of 25 Yoruba individuals in the African data set and 22 HGDP-CEPH Yoruba individuals. (B–H) Colored areas represent HGDP-CEPH utilization distribution ranges for full geographic regions, with the exception that the yellow shaded area in E represents the distribution range of 46 HGDP-CEPH Palestinian individuals. The dashed orange (B, H), green (B, G), and yellow (E) lines represent contours of the distribution ranges of 22 HGDP-CEPH Yoruba individuals, 17 HGDP-CEPH East Highlands individuals, and three HGDP-CEPH Middle Eastern populations, respectively. Locations of non-HGDP-CEPH individuals are indicated by the same symbols as in Figure 2.

