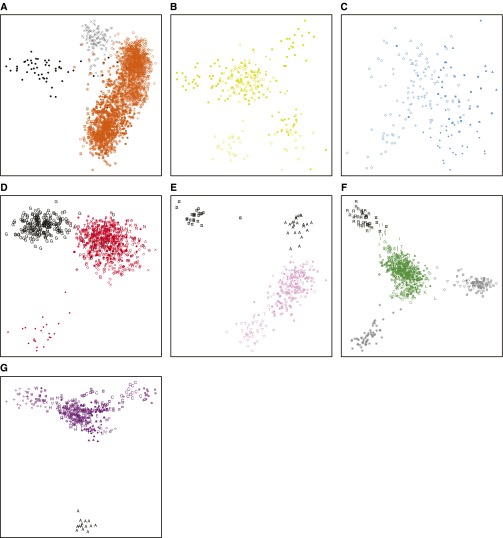
Figure 4.
Procrustes-transformed multidimensional scaling representations of separate individual allele-sharing distance matrices from each geographic region. (A) 2418 African, (B) 281 Middle Eastern, (C) 177 European, (D) 810 Central/South Asian, (E) 291 East Asian, (F) 697 Oceanian, and (G) 389 Native American individuals in the MS5435 data set are shown. Symbols follow Figure 2, with the following exceptions for populations specifically highlighted in the text: (A) Hadza individuals are shown in black and Pygmy individuals (Baka, Bakola, Bedzan, Biaka, and Mbuti) are shown in gray; (D) Gujarati individuals are shown in black; (E) Taiwanese individuals (Ami and Taruko) are shown in black; (F) individuals from inland populations—Baining (Malasait, Marabu, and Rangulit), Ata (Lugei & Uasilau), Mamusi (Kisiluvi & Lingite), and Nakani (Loso)—are shown in gray and Polynesians (Maoris and Samoans) are shown in black; (G) Aché individuals are shown in black.

