
Figure 1.
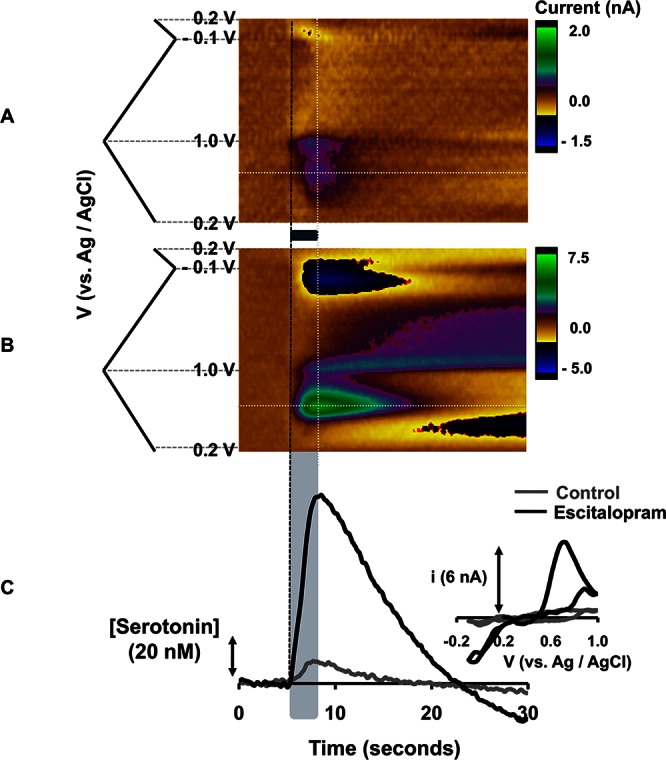
(A,B) Color plots with potential on the y-axis plotted against time on the x-axis and the current response represented in false color. These plots represent (A) the signal obtained in the SNr of an anesthetized mouse upon MFB stimulation (black bar under the color plot denotes the stimulation time and duration) (B) The same signal 1 h after ESCIT (10 mg kg–1) administration. (C) [Serotonin] vs time extrapolated from the horizontal dashed lines in (A) and (B) with inset cyclic voltammograms taken from the vertical white dashed lines.