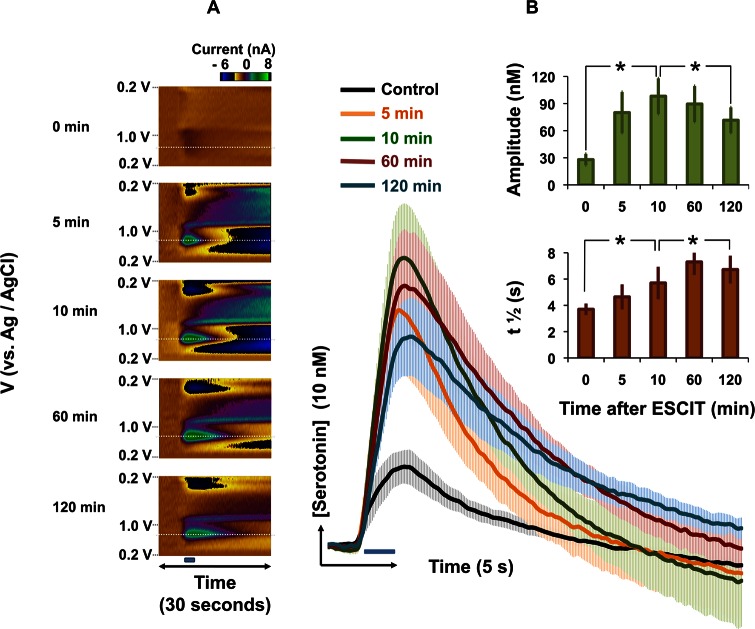
Figure 2.
(A) Color plots with potential on the y-axis plotted against time on the x-axis and the current response represented in false color. These plots represent the time course of the serotonin signal after ESCIT administration in a representative animal. (B) [Serotonin] vs time, averaged for five animals (±SEM) taken from the maximum current value from the horizontal white dashed lines from each time course. The blue bar denotes stimulation onset and duration. Inset: Histograms showing maximum serotonin amplitude (green) and t1/2 (orange) with time after ESCIT administration. Stars represent statistically different significance of comparisons between data sets (p = 0.05 is used as a two-tailed cutoff for statistical significance).

