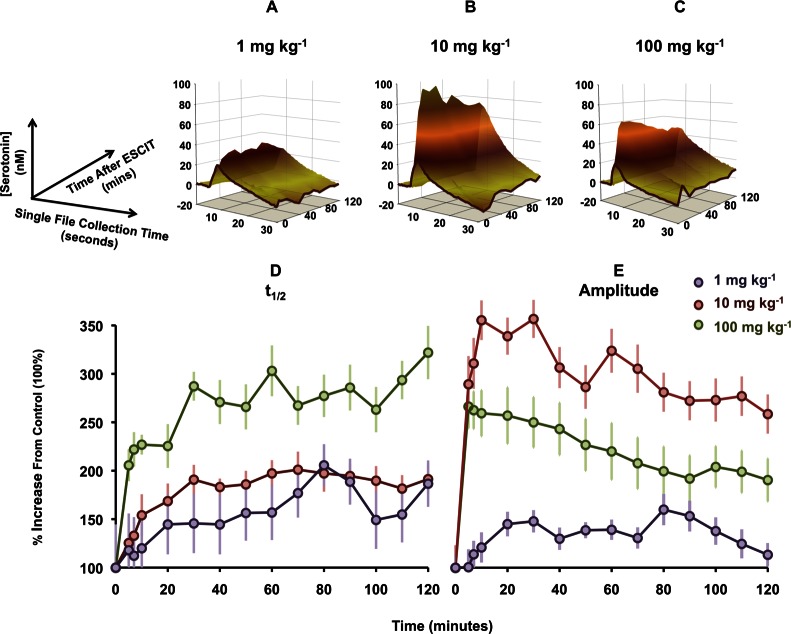
Figure 3.
Dose responses to varying doses of ESCIT (A–C). The three-dimensional plots are [serotonin] vs time vs time after ESCIT administration. (D,E) Maximal values of amplitude and t1/2, respectively, taken from (A)–(C) at each time course for each dose. Values are presented as a percent change from baseline.

