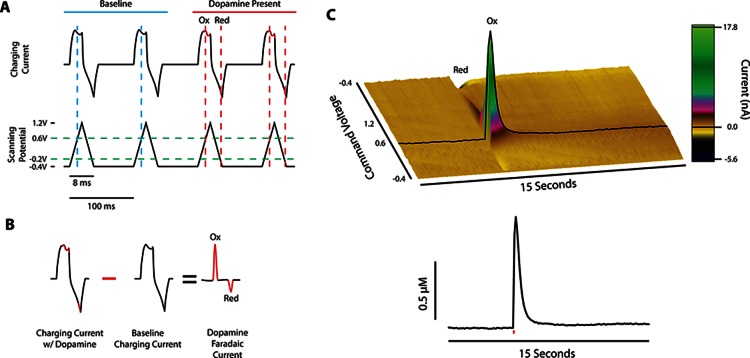
Figure 1.
Fast scan cyclic voltammetry methodology for subsecond detection of dopamine. (A) Black traces show the charging current (top) resulting from a voltage sweep (bottom) in the absence (blue) and presence (red) of dopamine. Dopamine oxidation and reduction occur at 0.6 and −0.2 V (intercept of green and red dashed lines), respectively. (B) Charging currents containing dopamine are subtracted from baseline currents, resulting in a faradaic current proportional to the concentration of dopamine present. (C) Color plot of background subtracted data after an electrical stimulation shows dopaminergic changes in faradaic current across time (top panel), which can be represented two-dimensionally as change in DA concentration across time (bottom panel). Red line in bottom panel represents single-pulse electrical stimulation. The oxidation current traces from a color plot are compared with electrode calibration factors to determine release concentrations, and dopamine clearance is calculated to determine dopamine transporter function.

