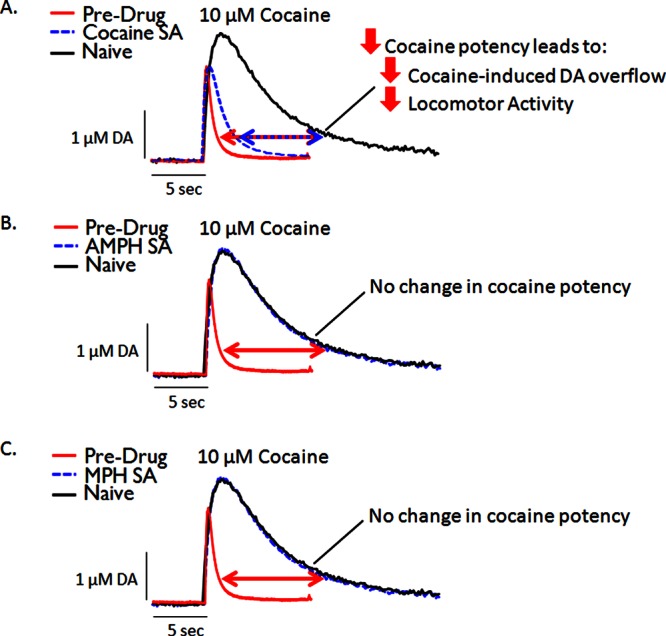
Figure 3.

Representative voltammetric dopamine traces highlighting the effects of cocaine, amphetamine (AMPH), and methylphenidate (MPH) self-administration (SA) on cocaine potency. For all panels (not real data), red traces represent typical baseline (predrug) release and uptake of dopamine in both naïve and cocaine SA animals. Black traces represent typical dopamine release and uptake following application of cocaine in naïve animals. Uptake is inhibited when cocaine is applied, leading to greater maximal peak-height and slower return to baseline. Blue traces represent inhibition of dopamine uptake following application of cocaine in animals with a history of cocaine (A), AMPH (B), or MPH (C) SA. Note that the blue trace in Panel A (cocaine SA) exhibits a reduced maximal peak-height and reduced rightward-shift in the descending limb of the curve relative to the black trace (naïve). Therefore, cocaine SA produces tolerance to the neurochemical effects of cocaine (A), while AMPH (B) or MPH (C) self-administration does not affect cocaine potency. (See refs (15−17 and 49) for supporting data.)
