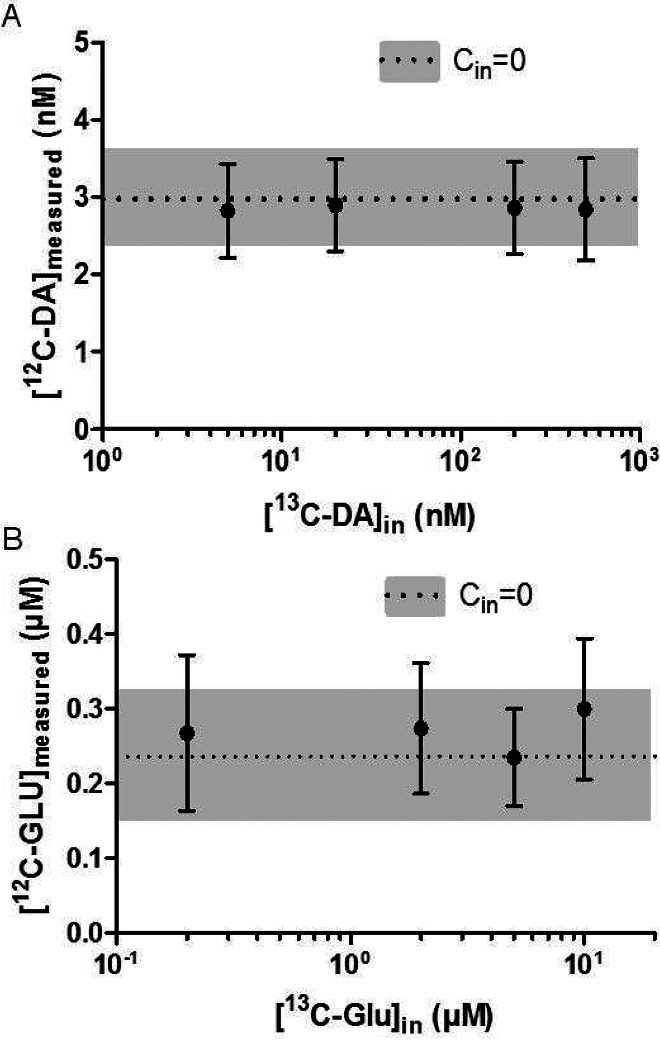
Figure 2.
(A) When varying concentrations of 13C6-DA perfused through the probe, 12C-DA measured remained constant. The dotted line indicates the CoutDA when Cin = 0, and the gray bars represent the SEM with no 13C6-DA perfused (N = 5, error bars are SEM). (B) Perfusing up to 10 μM 13C5-GLU had no effect on the endogenous concentration of GLU. The dotted line and gray bar indicate CoutGLU when Cin = 0. N = 5, error bars show SEM.

