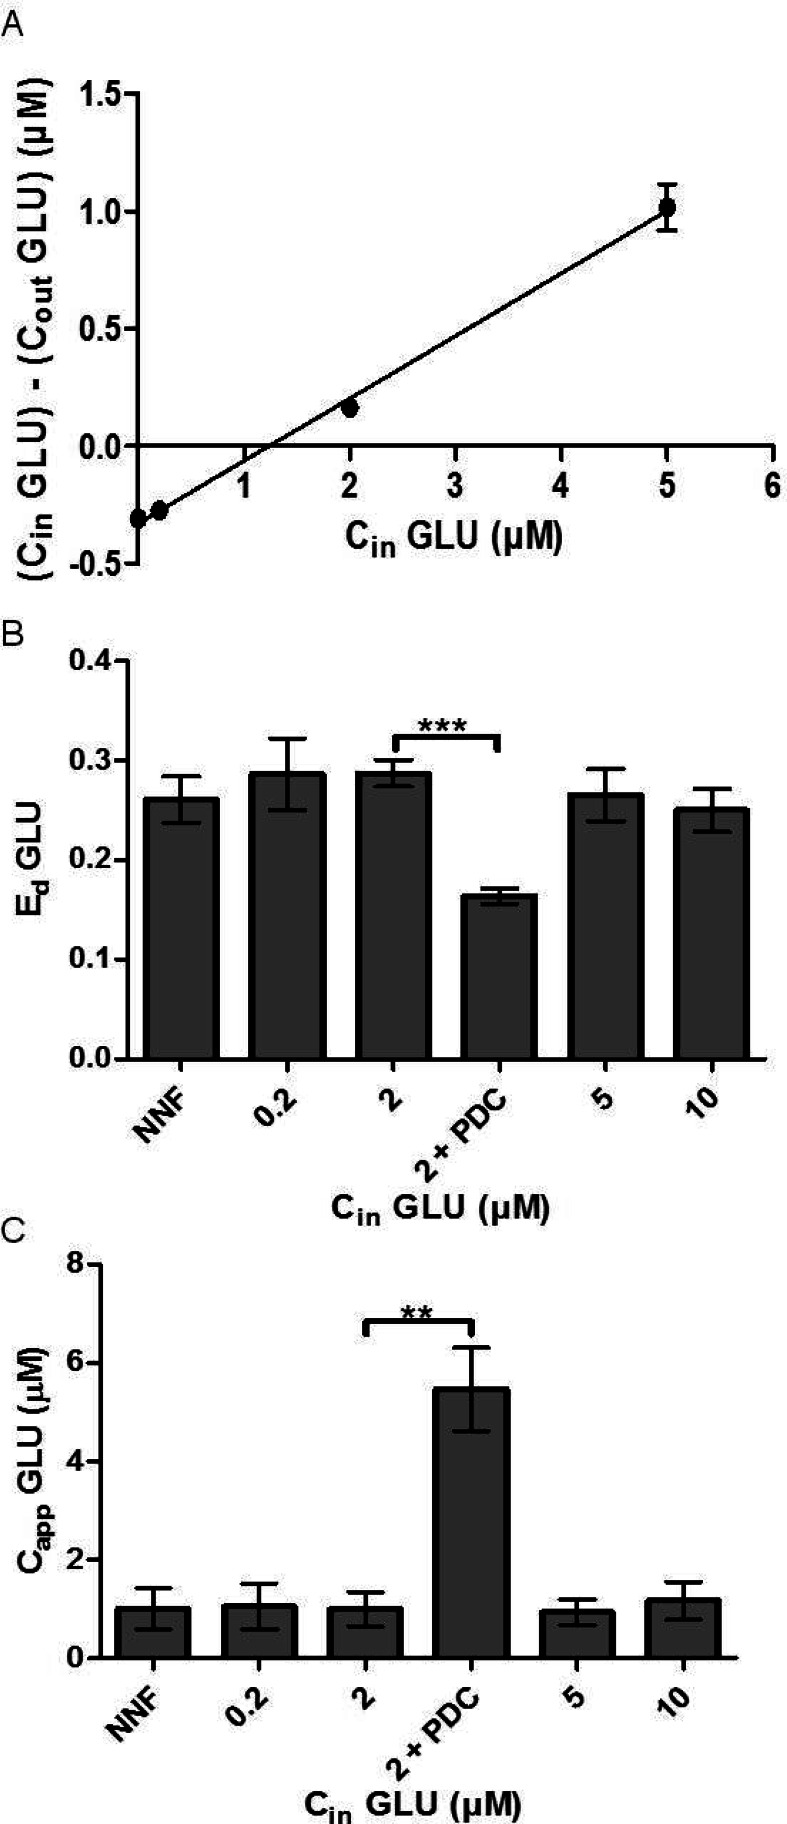
Figure 4.
(A) Sample NNF curve is shown when perfusing varying concentrations of 13C5-GLU through the probe. Cout was calculated by summing [13C5-GLU measured] and [12C-GLU measured]. (B) SIL retrodialysis was compared to NNF to measure EdGLU. Ed SIL retrodialysis values matched that of the NNF values. 750 μM PDC was perfused with 2 μM 13C6-DA, which decreased EdGLU (p < 0.001, unpaired t test). (C) Ed and [12C-GLU measured] were used to calculate CappGLU. Capp for SIL retrodialysis matched CappGLU measured by NNF. After perfusion of 750 μM PDC, Capp increased 550% (p-value < 0.001). Error bars show SEM (n = 5 except for PDC infusion, n = 4).

