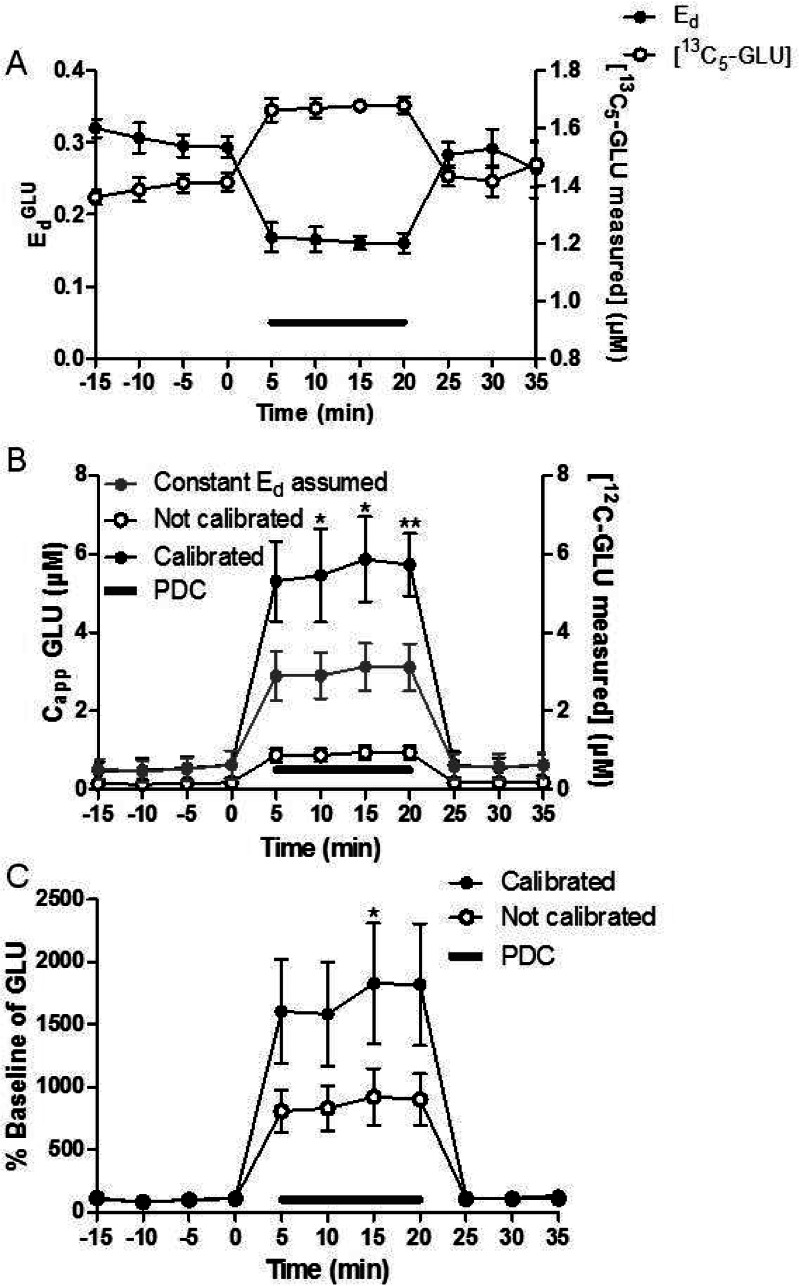
Figure 6.
(A) EdGLU was measured as 750 μM PDC was perfused (gray line) through the probe. Ed (black solid circles) values reached the minimum value within 5 min (p-value < 0.001 compared to aCSF). With 2 μM 13C5-GLU perfused through the probe, the addition of PDC to the perfusate increased [13C5-GLU measured] (right axis, black open circles). (B) [12C-GLU measured] (right axis, black open circles), CappGLU with constant Ed assumed (EdGLU measured prior to PDC, gray solid circles), and Capp (black solid circles) were measured as PDC was perfused. CappGLU was on average 190% higher compared to Capp with a constant EdGLU assumed (p-value < 0.001). (C) % baseline of GLU for calibrated (black solid circles) vs conventional (black open circles) microdialysis is shown. The calibrated measurements were 200% larger compared to the conventional microdialysis (p-value < 0.001). Paired t tests were used for individual fractions to test significance as well. Error bars show SEM (n = 4). ** indicates p-value < 0.01, and * indicates p-value < 0.05.

