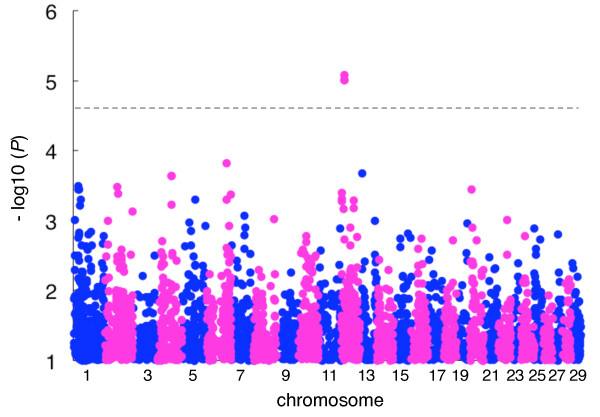
Figure 2.
Manhattan plot of the association of 33,303 SNPs with NCP4 in 688 Japanese Black cattle. The chromosomes are distinguished with alternating colors (blue, odd numbers; red, even numbers). The chromosome number is indicated on the x-axis. The dashed line is the genome-wide significance threshold (−log10 (P) = 4.60) [5-7]. The vertical axis is broken for P values below -log10 (1).

