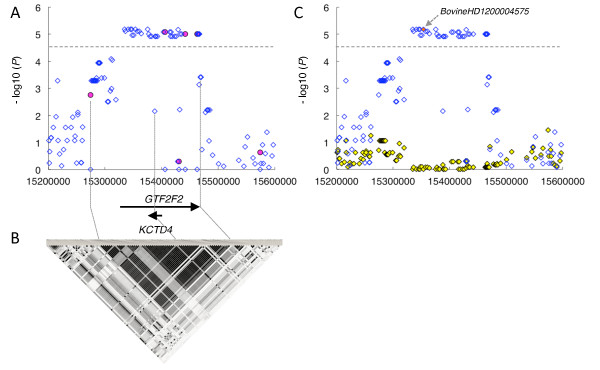
Figure 3.

Regional plot of the locus on BTA12 associated with NCP4. (A) Regional plot of the locus on BTA12 associated with NCP4. SNPs from the 50K SNP chip are shown as red circles. The imputed SNPs are shown as unfilled blue diamonds. Genes and their directions of transcription are noted at the bottom of the plot. (B) The lower panels show estimates of the square of the correlation coefficient (r2) calculated for each pairwise comparison of SNPs. The r2 values are indicated by a black/white gradient: white represents r2 = 0, shades of gray represent 0 <r2 < 1, and black represents r2 = 1. (C) A conditioned analysis was performed by including a genotype of BovineHD1200004575, one of the most closely associated SNPs on BTA12, as a covariate in the model. A red filled diamond indicates the BovineHD1200004575 (arrow). The blue unfilled and yellow filled diamonds represent P values in –log10 scale before and after conditioning, respectively.
